The MPM platform
The MPM platform allows you to both view model performance metrics, deep dive into the drift of specific features, create custom metrics and alerts, and more.
Models page
The MPM models page displays all models that are being tracked in the MPM platform with some additional information to make it easier to identify which models require your attention. For each model, we will display the number of open alert notifications, when the last prediction was made as well as the number of predictions made over the last 30 days.
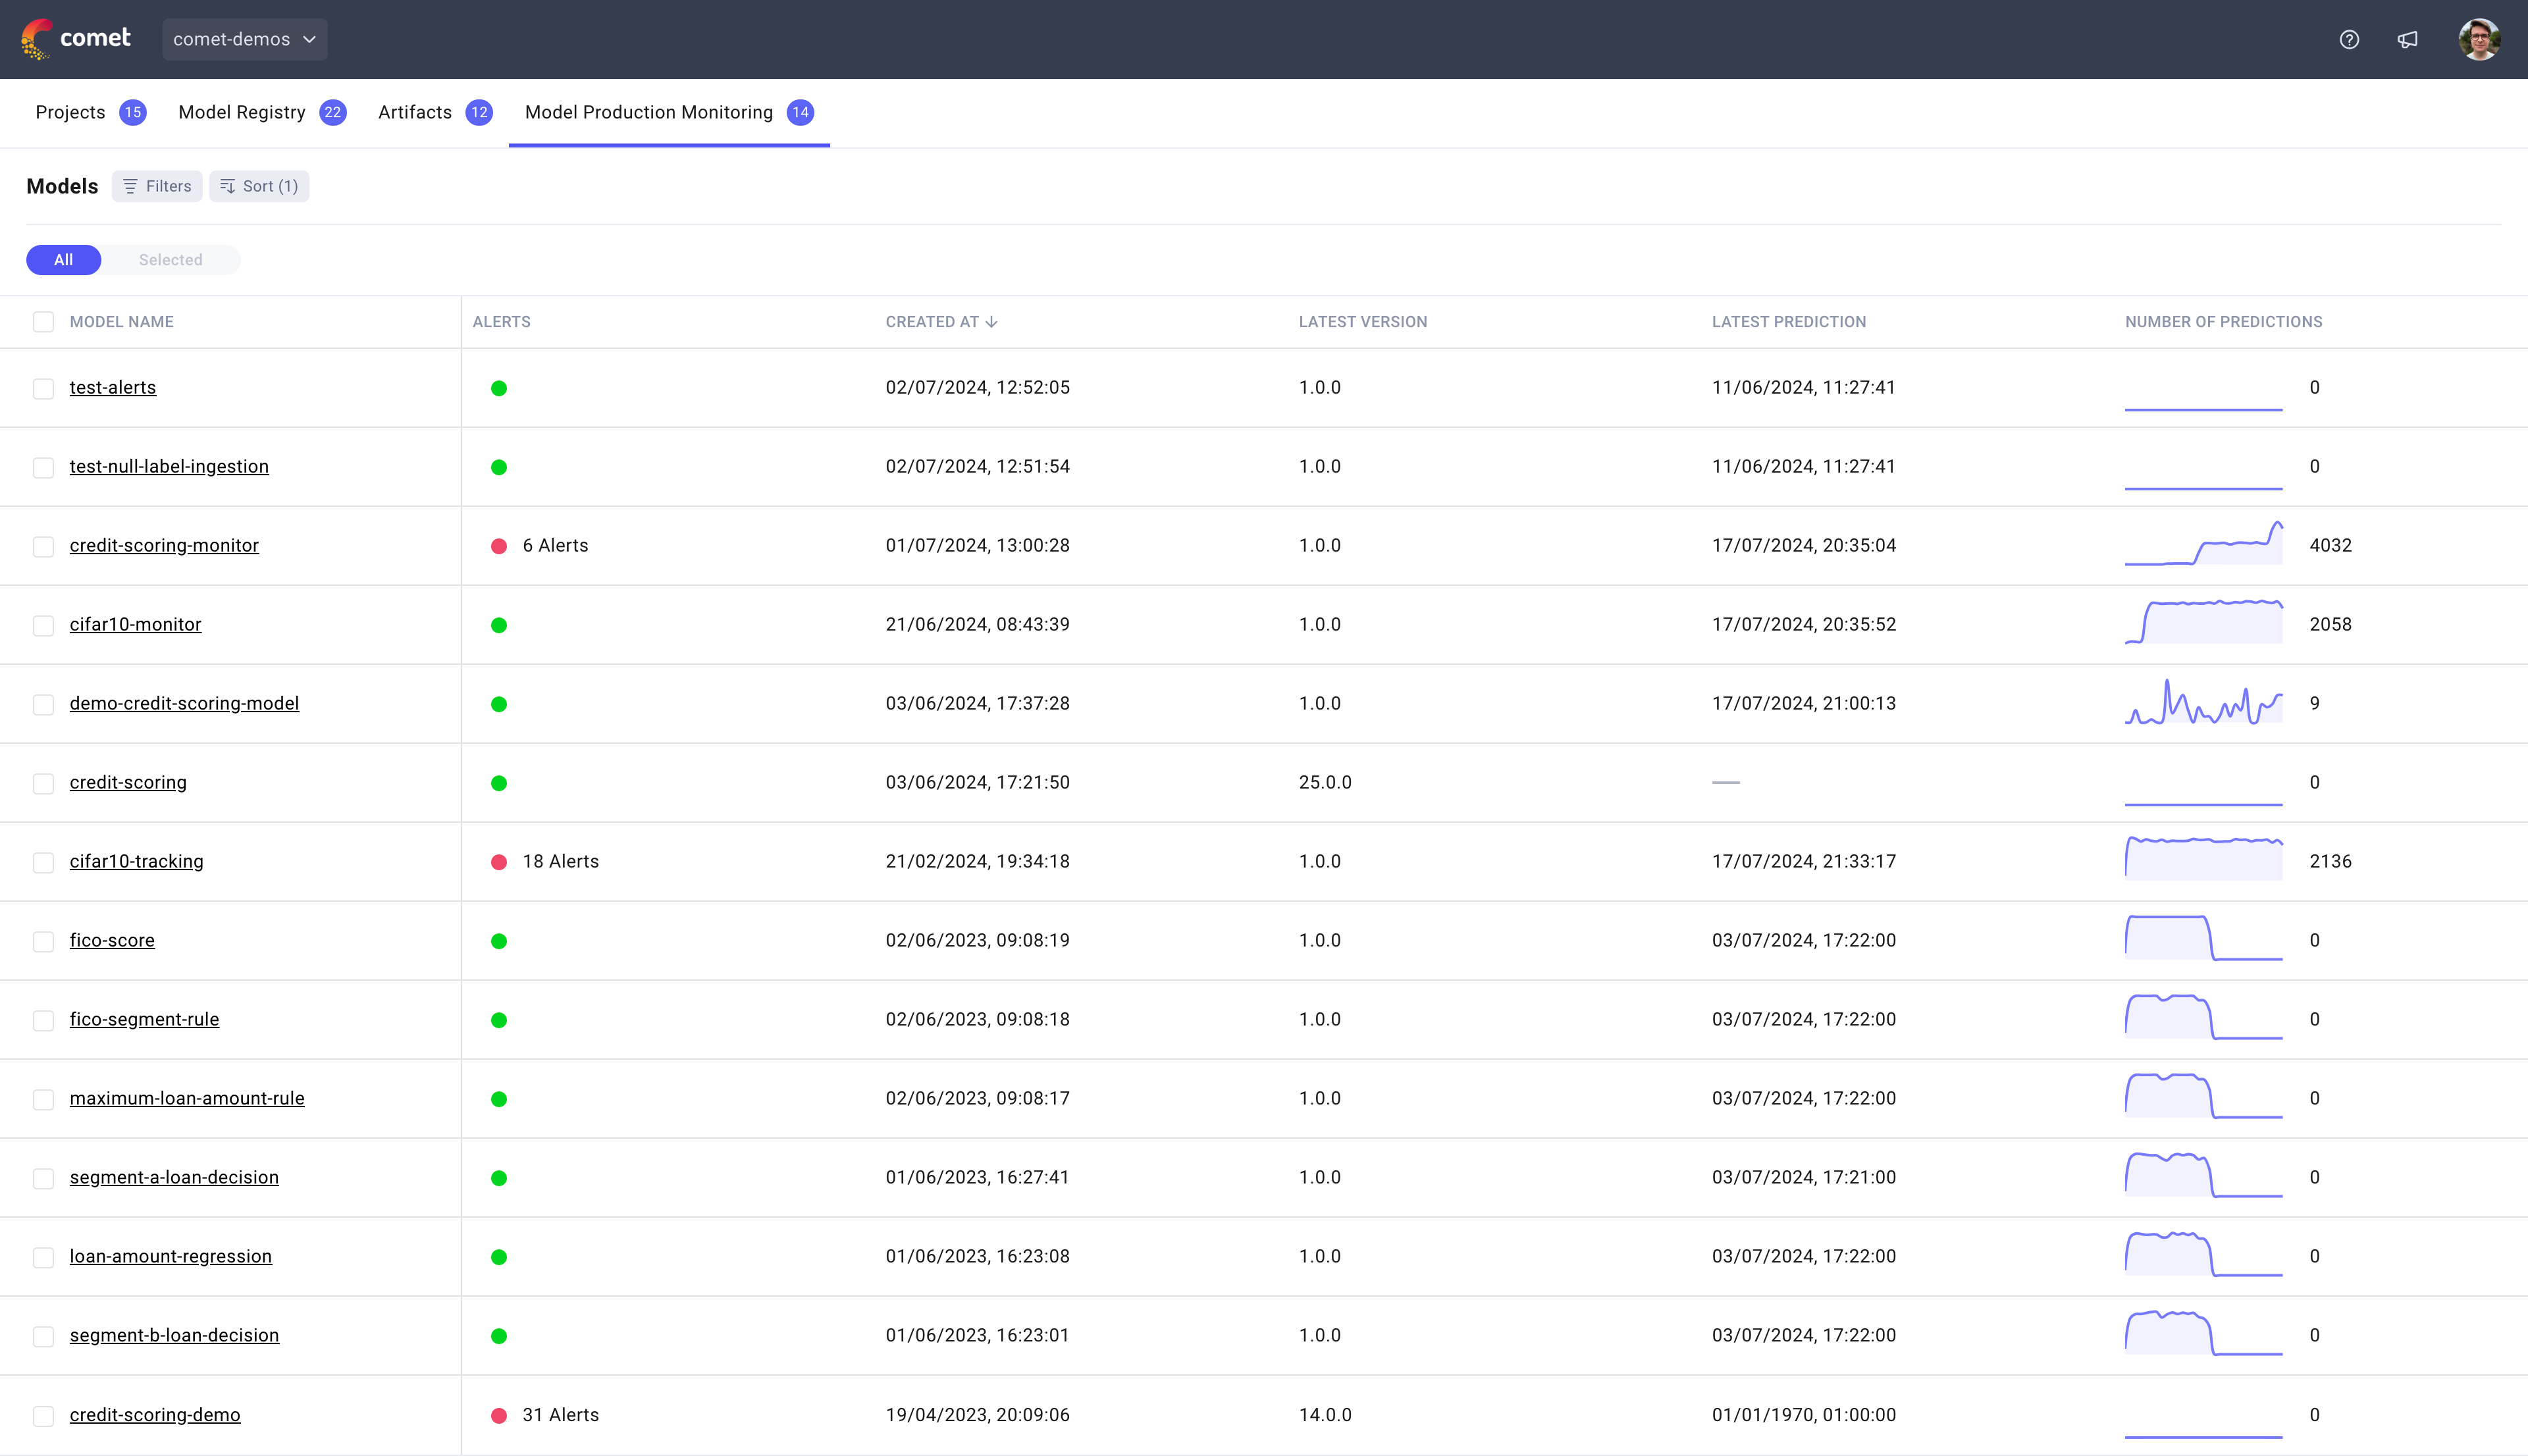
To learn more about a specific model, you can click on the model name.
Note
Each model in MPM has a corresponding model in the Model Registry allowing you to track the lineage of each model from development to production.
To delete a model, simply delete the corresponding model in the Model Registry.
Model Performance page
Once you click into a model, you will be presented with the Model Performance page which allows you to track the overall health of the model.
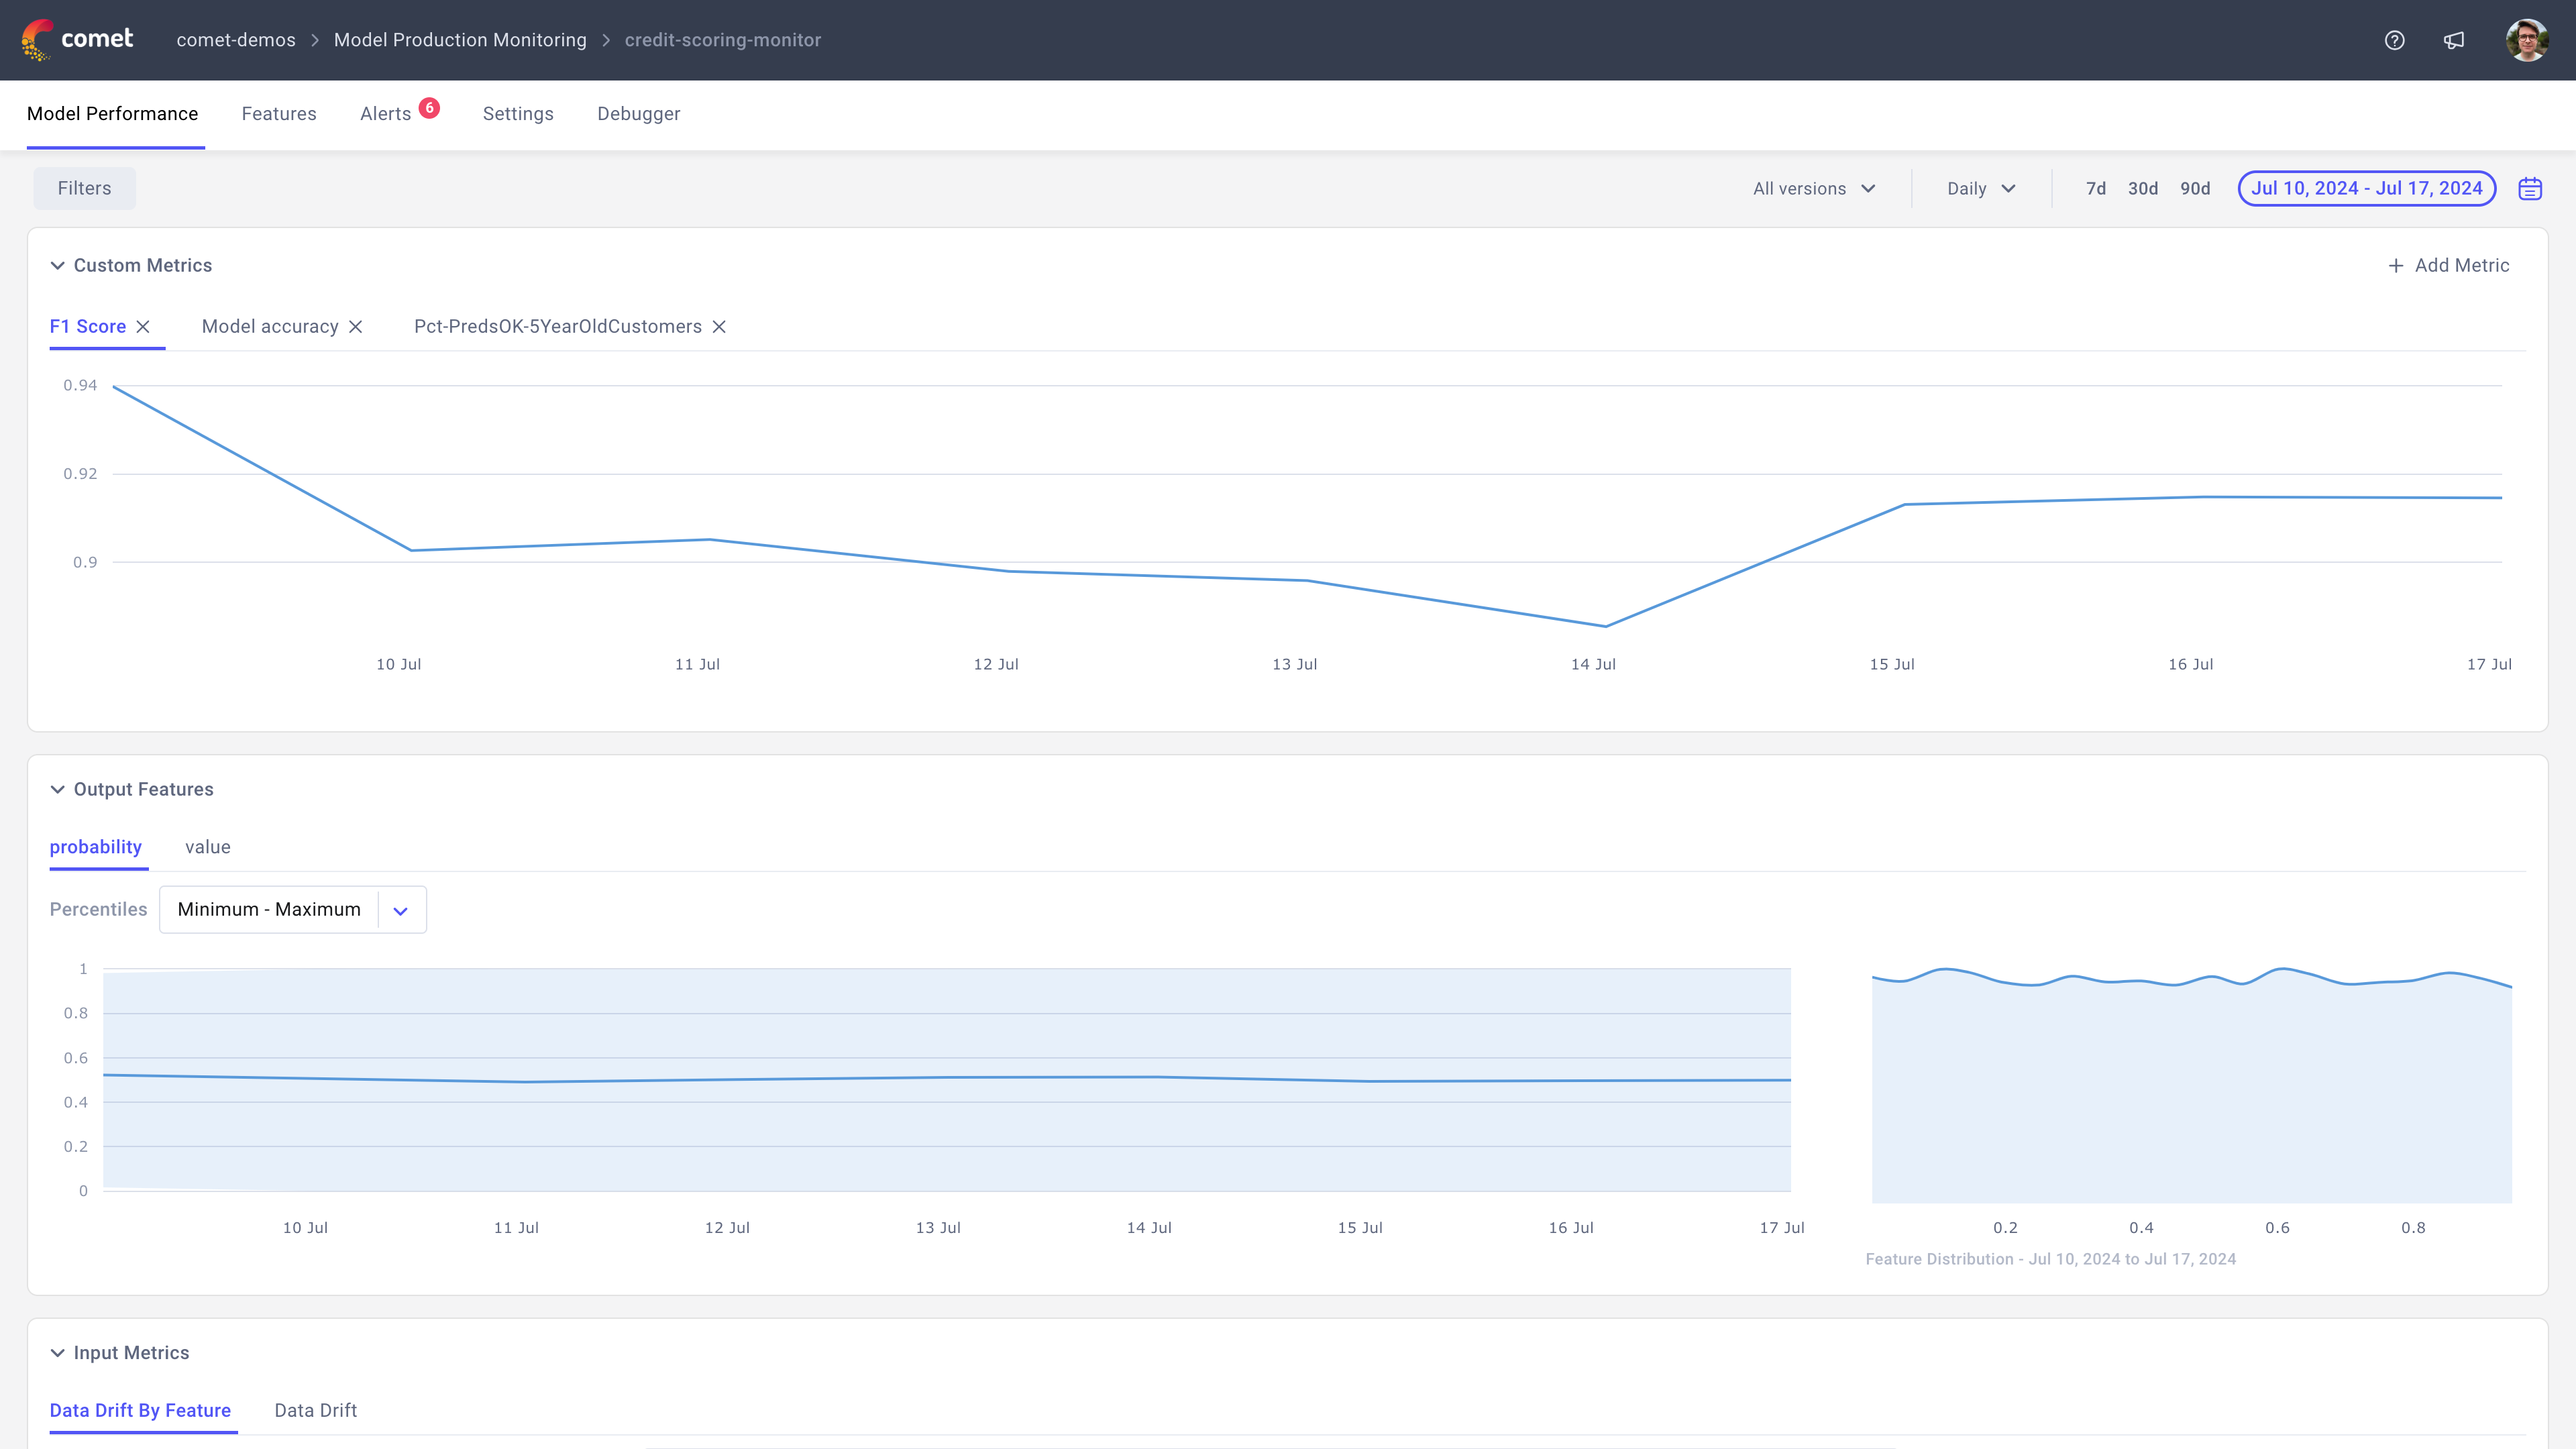
This page contains three panel sections:
- Custom metrics: Allows you to track both accuracy related metrics and custom metrics. To create a new metric, simply click on
+ Add Metric. - Output features: Allows to track the distribution of your output features which are often the first ones to drift when there is an issue with your model. Each tab of this section will correspond to one of your output features.
- Input drift: Allows you to track the drift of the input features over time. This section contains two tabs, one showing the average drift over all the features selected in the
Featuresselector and another showing the drift of each individual feature selected. - Number Of Predictions: Allows you to track the number of predictions tracked for this model.
In addition to being able to view these high level model metrics, you can narrow down the data you want to view by filtering the data, selecting a specific model version to track or switching between hourly and daily data.
Features page
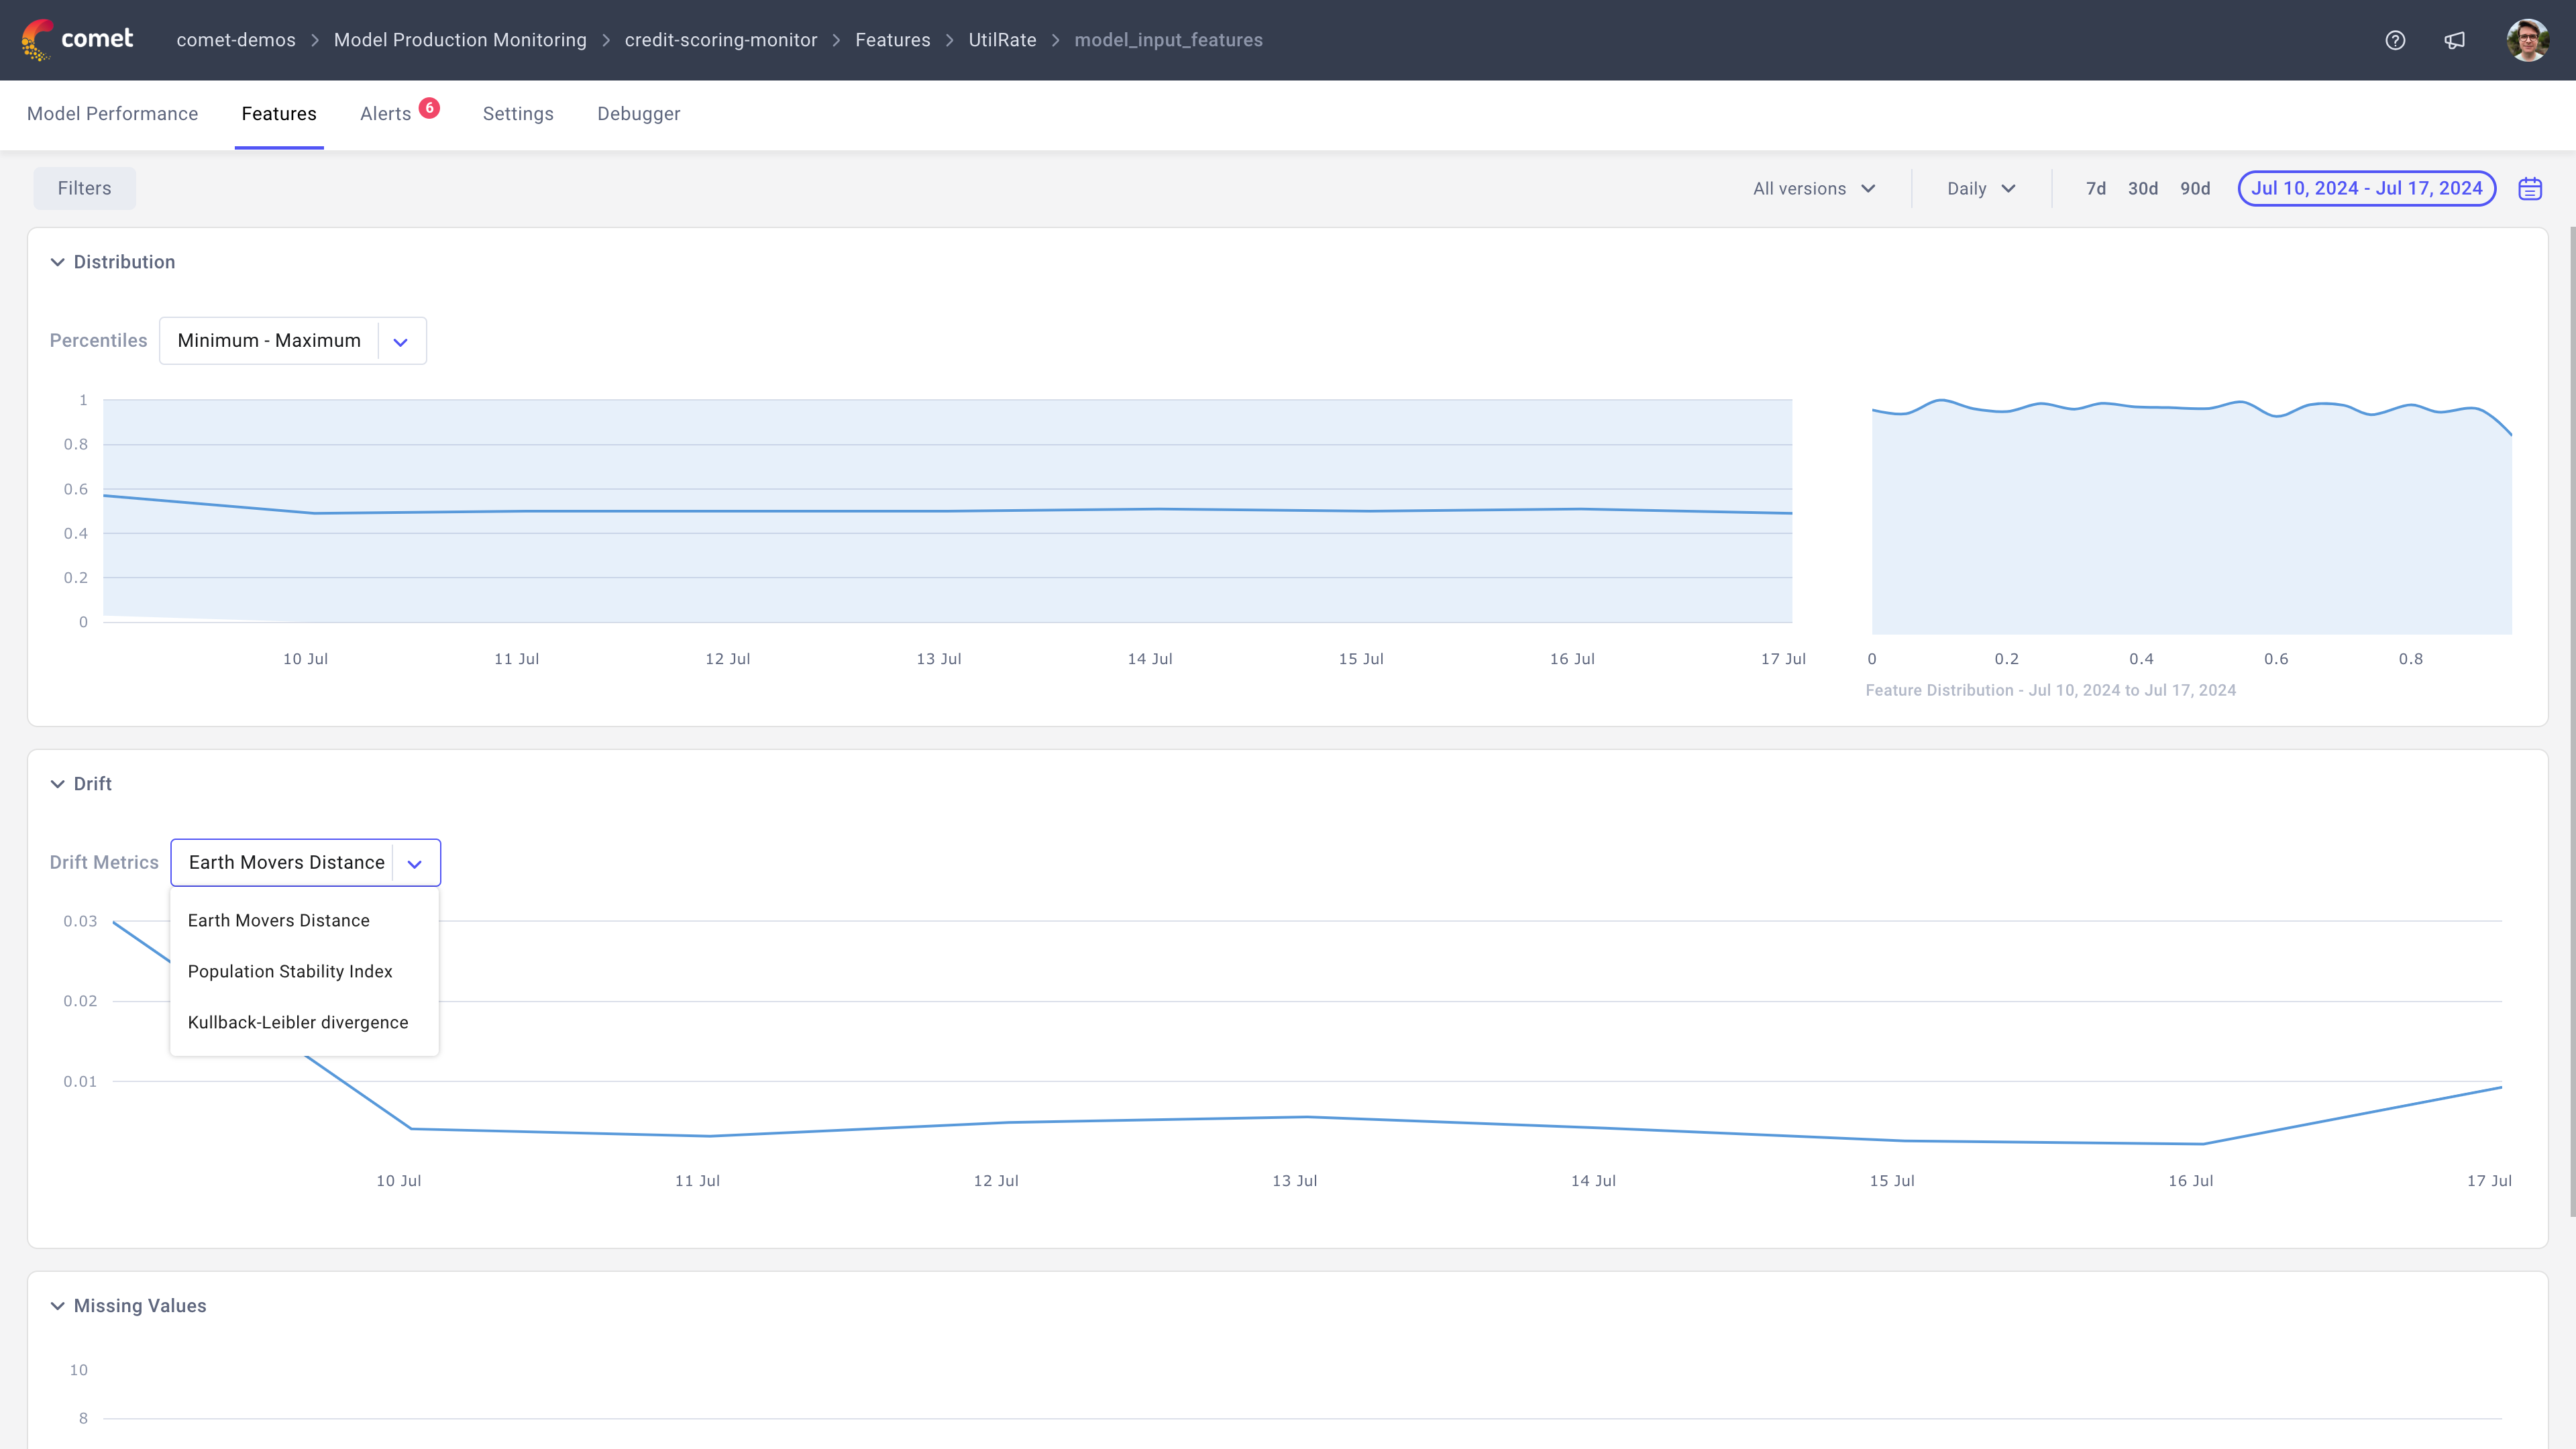
The features page displays a summary table for each model tracked and provides a way for you deep-dive into a specific feature.
Once a feature is selected, you will be presented with three panel sections:
- Distribution: Allows you to track the distribution of this feature over time.
- Drift: Allows you to track the drift of this feature over time. We support three different drift metrics:
Earth Mover's Distance,Population Stability IndexandKullback-Leibler divergence. - Missing values: Allows you to track the number of predictions that didn't have this feature.
Note
By default the drift is computed as the difference in the distributions of the current and previous time periods. If you would like to compute the drift based on a training distribution instead, simply navigate to the Settings tab and select your preferred baseline for the drift calculation.
You can learn more about sending training distributions here: Sending training distributions
Alerts page
The alerts page allows you to both define alerts, view alert notifications and resolve alert notifications.
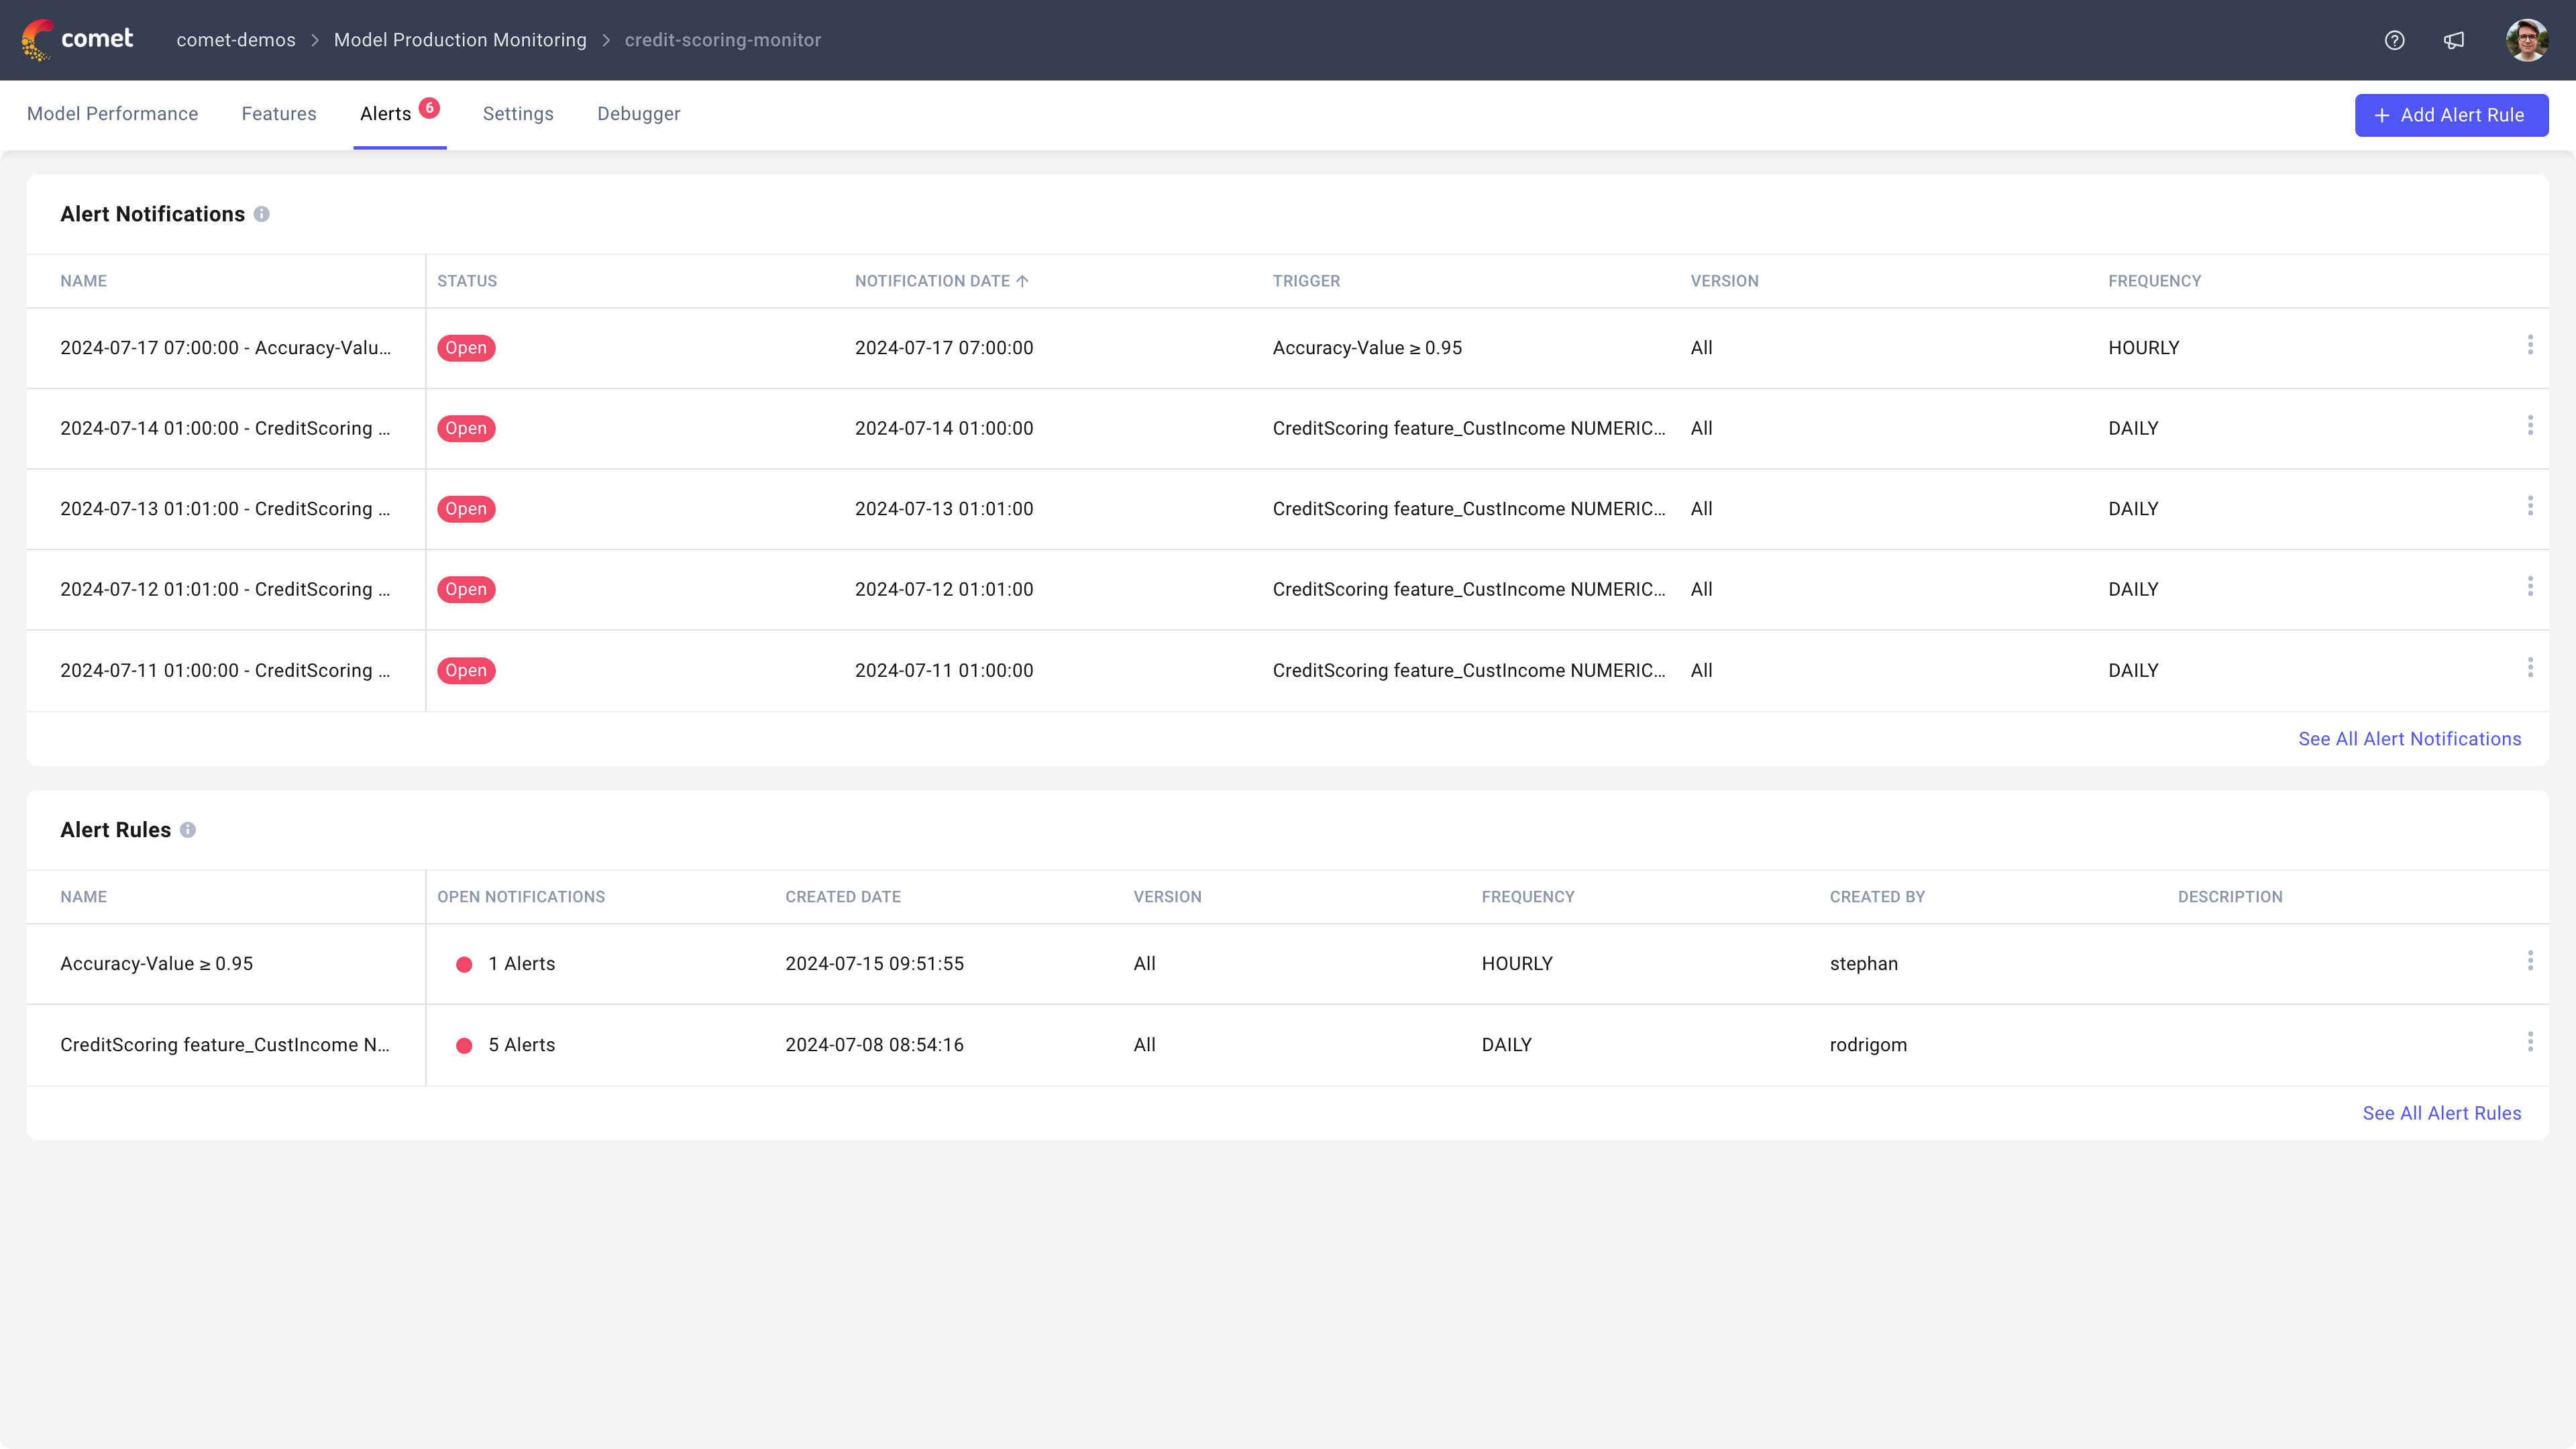
To create a new alert, click on the + Add Alert Rule button which will open a new page where you can define the alert rule. From there, you will be able to create an alert on any of metrics tracked in Comet including custom metrics. You can also customize the alerts further by defining a filter so only a subset of your data is used to compute the alert. When the alert is fully configured, simply click Save.
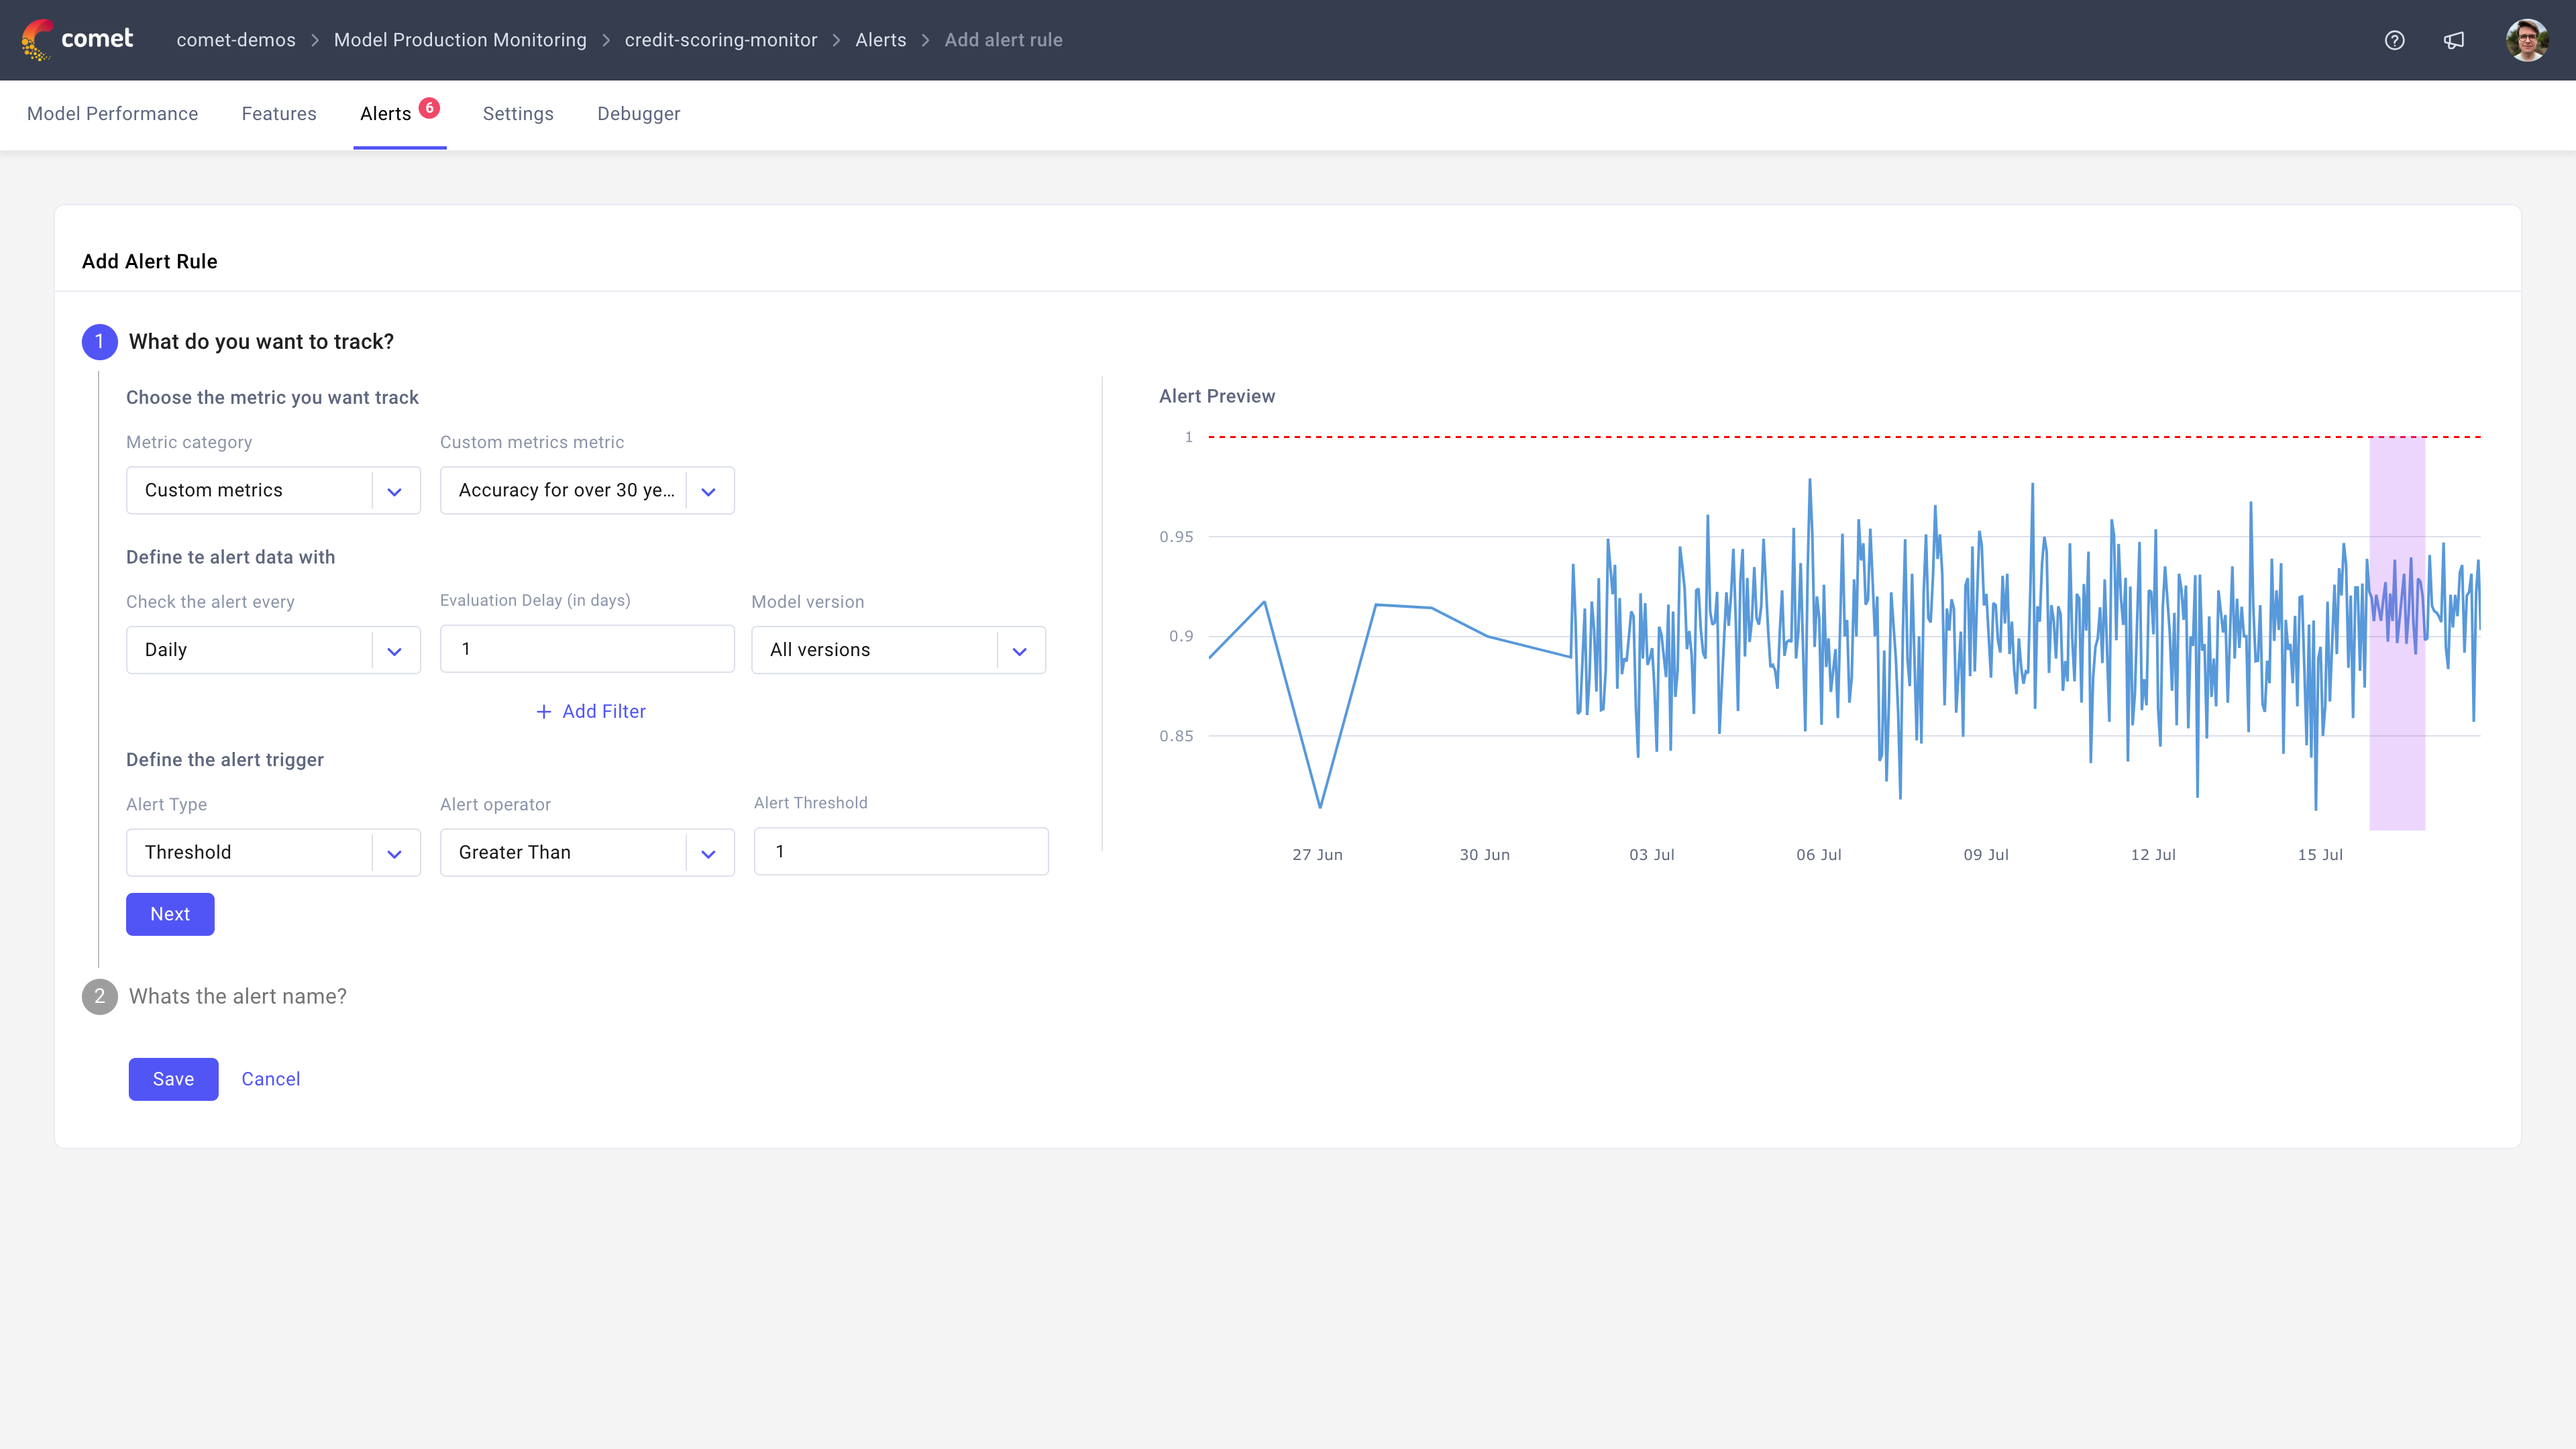
Note
If you have late arriving labels and are defining an alert on these, we recommend using the evaluation
delay option to delay the evaluation of the alert until the label arrives. This will ensure that the alert is only evaluated when the label is available.
If you are defining an alert on accuracy and set the evaluation delay to 7 days for example, each Monday we will compute the accuracy value for the previous Monday and trigger an alert if it is above or below the selected threshold.
Settings page
The settings page allows you to define some model level configurations, namely:
- The baseline distribution to use when computing drift
- Custom metrics
You can learn more about configuring custom metrics here: Configuring custom metrics
Debugger page
The debugger page provides a real-time view into the events that are being processed by the MPM platform. This view is particularly useful if you are trying to debug why a specific event is not being processed.
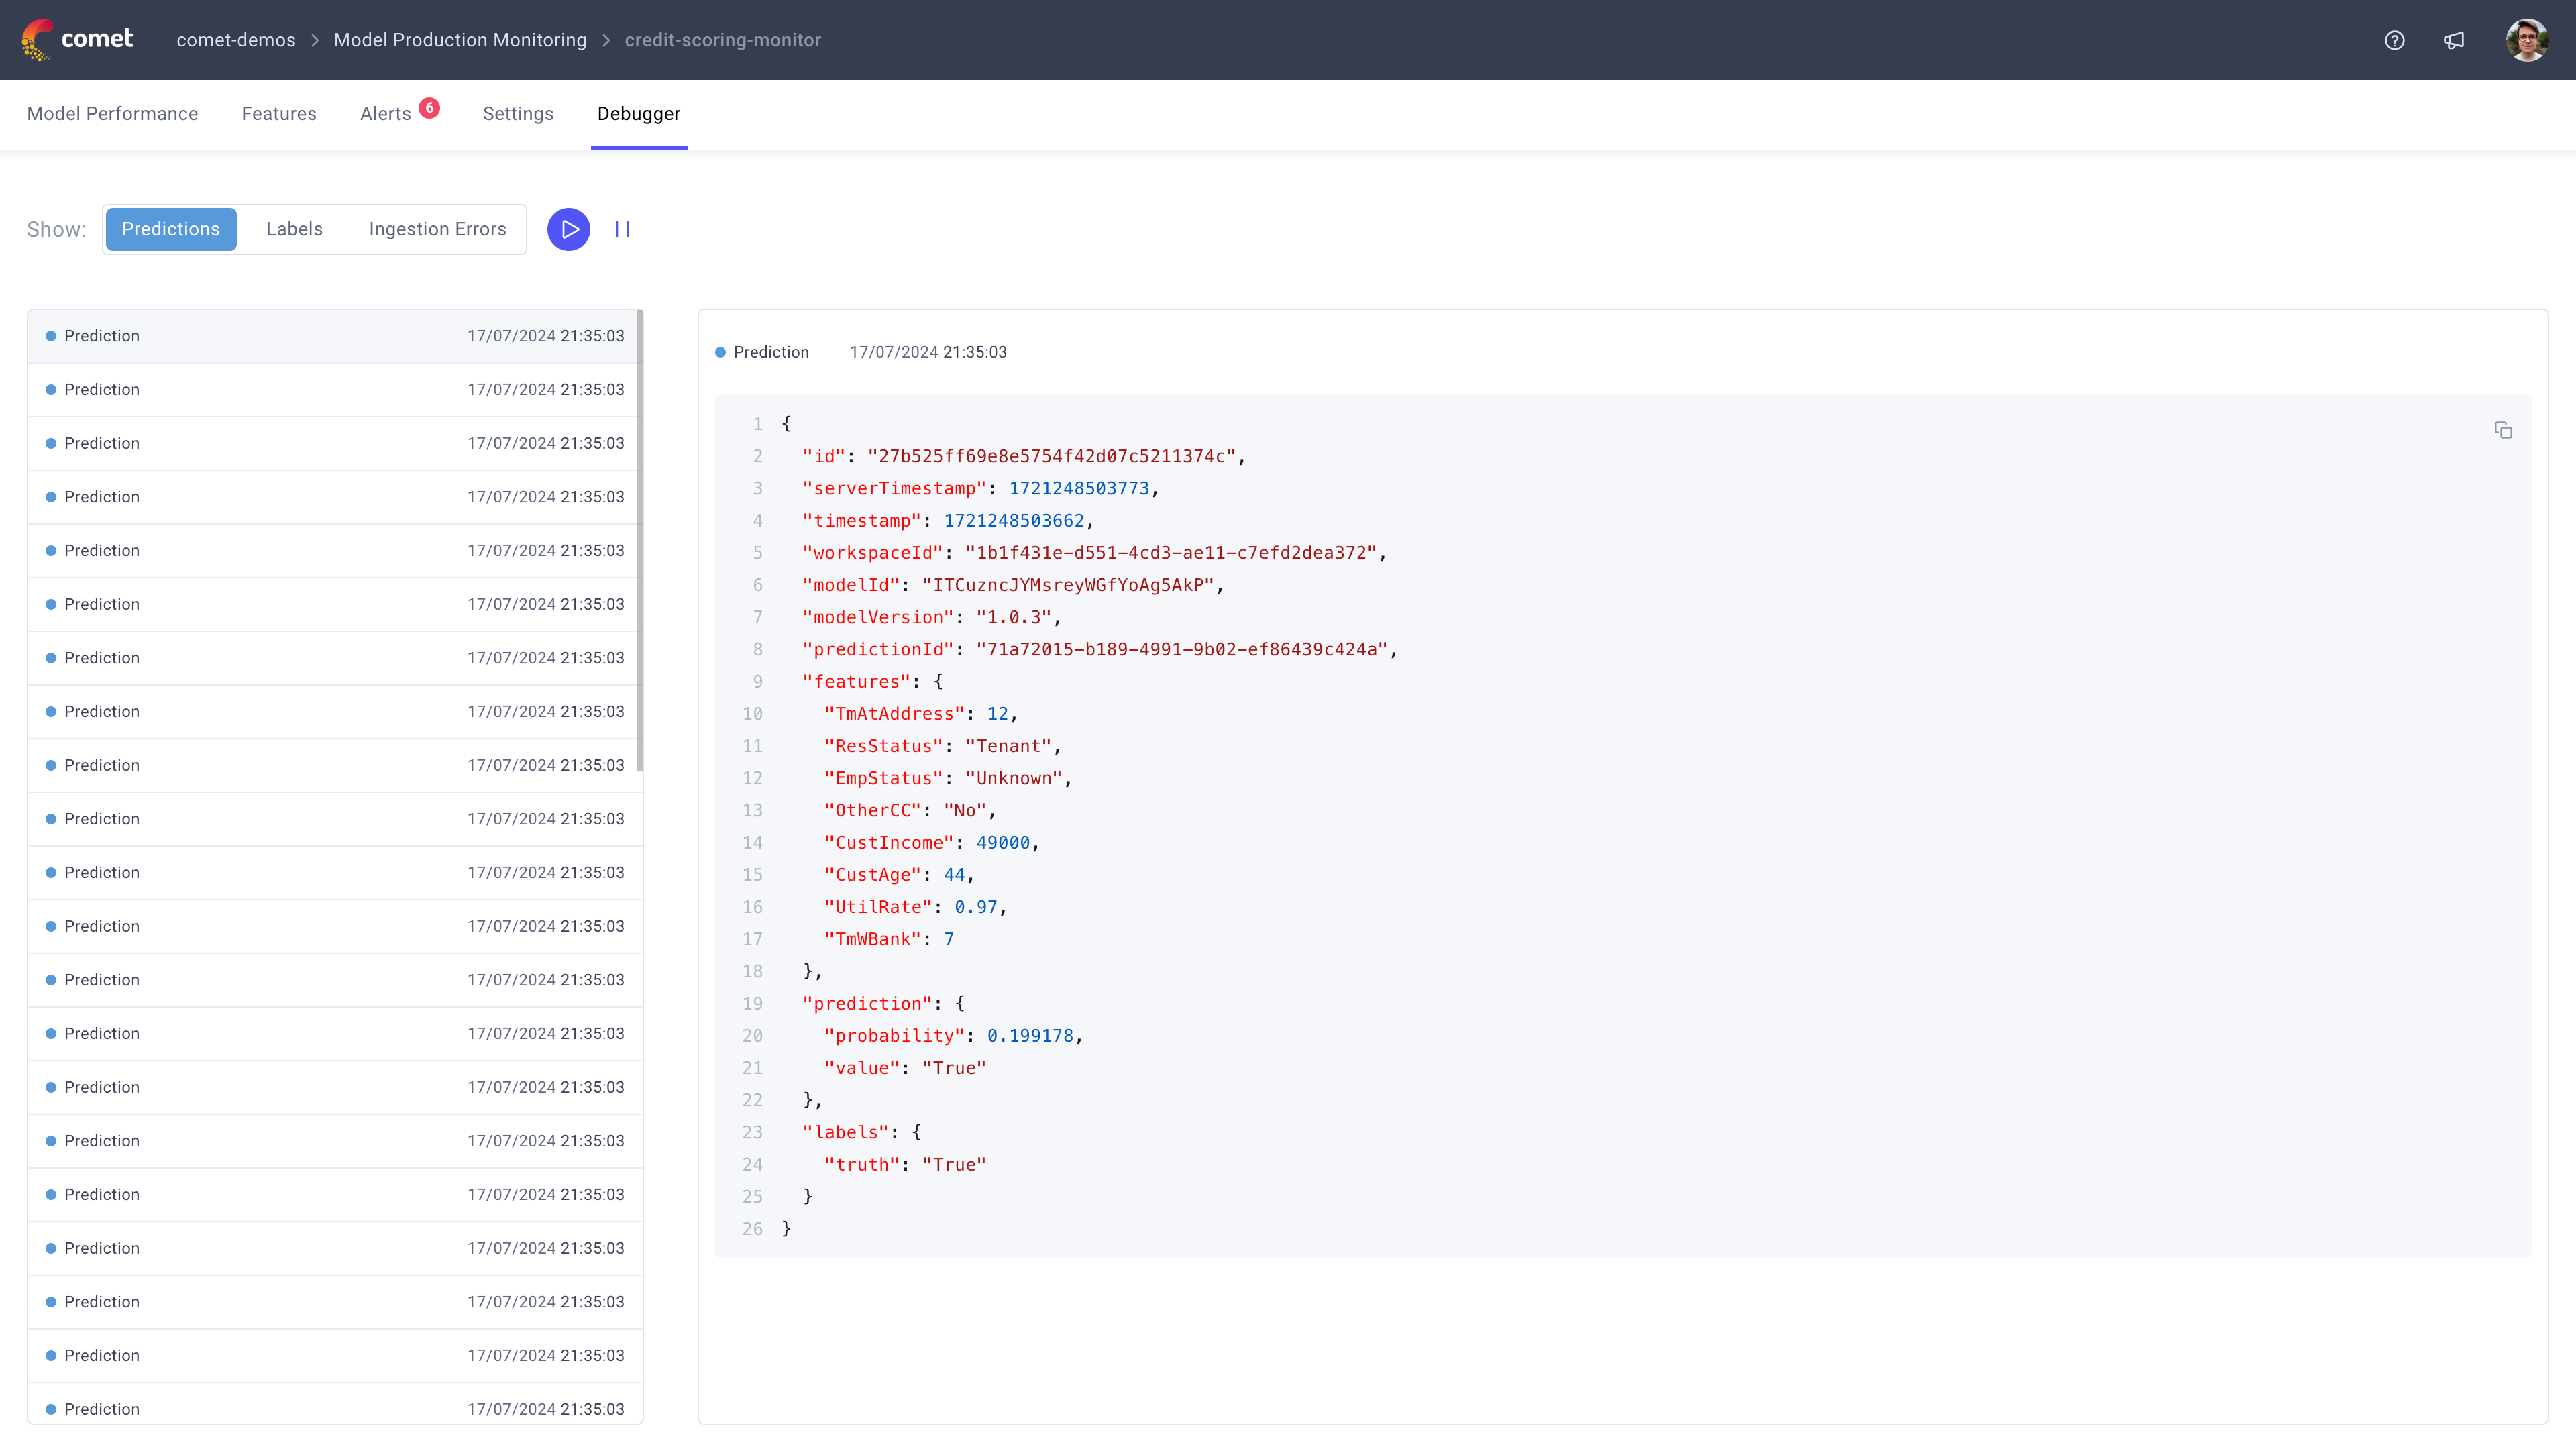
Note
It can take up to 5 minutes for events to appear in the debugger tab once data is received by Comet. If you are not seeing events that you have sent, get in contact with the Comet team at support@comet.com.
Learn more
To learn more about how to send data to MPM, check out the following guide: Sending data to MPM