Total fidelity metrics
When you need to go beyond the normal limits, you can configure Comet to store metric data with total fidelity.
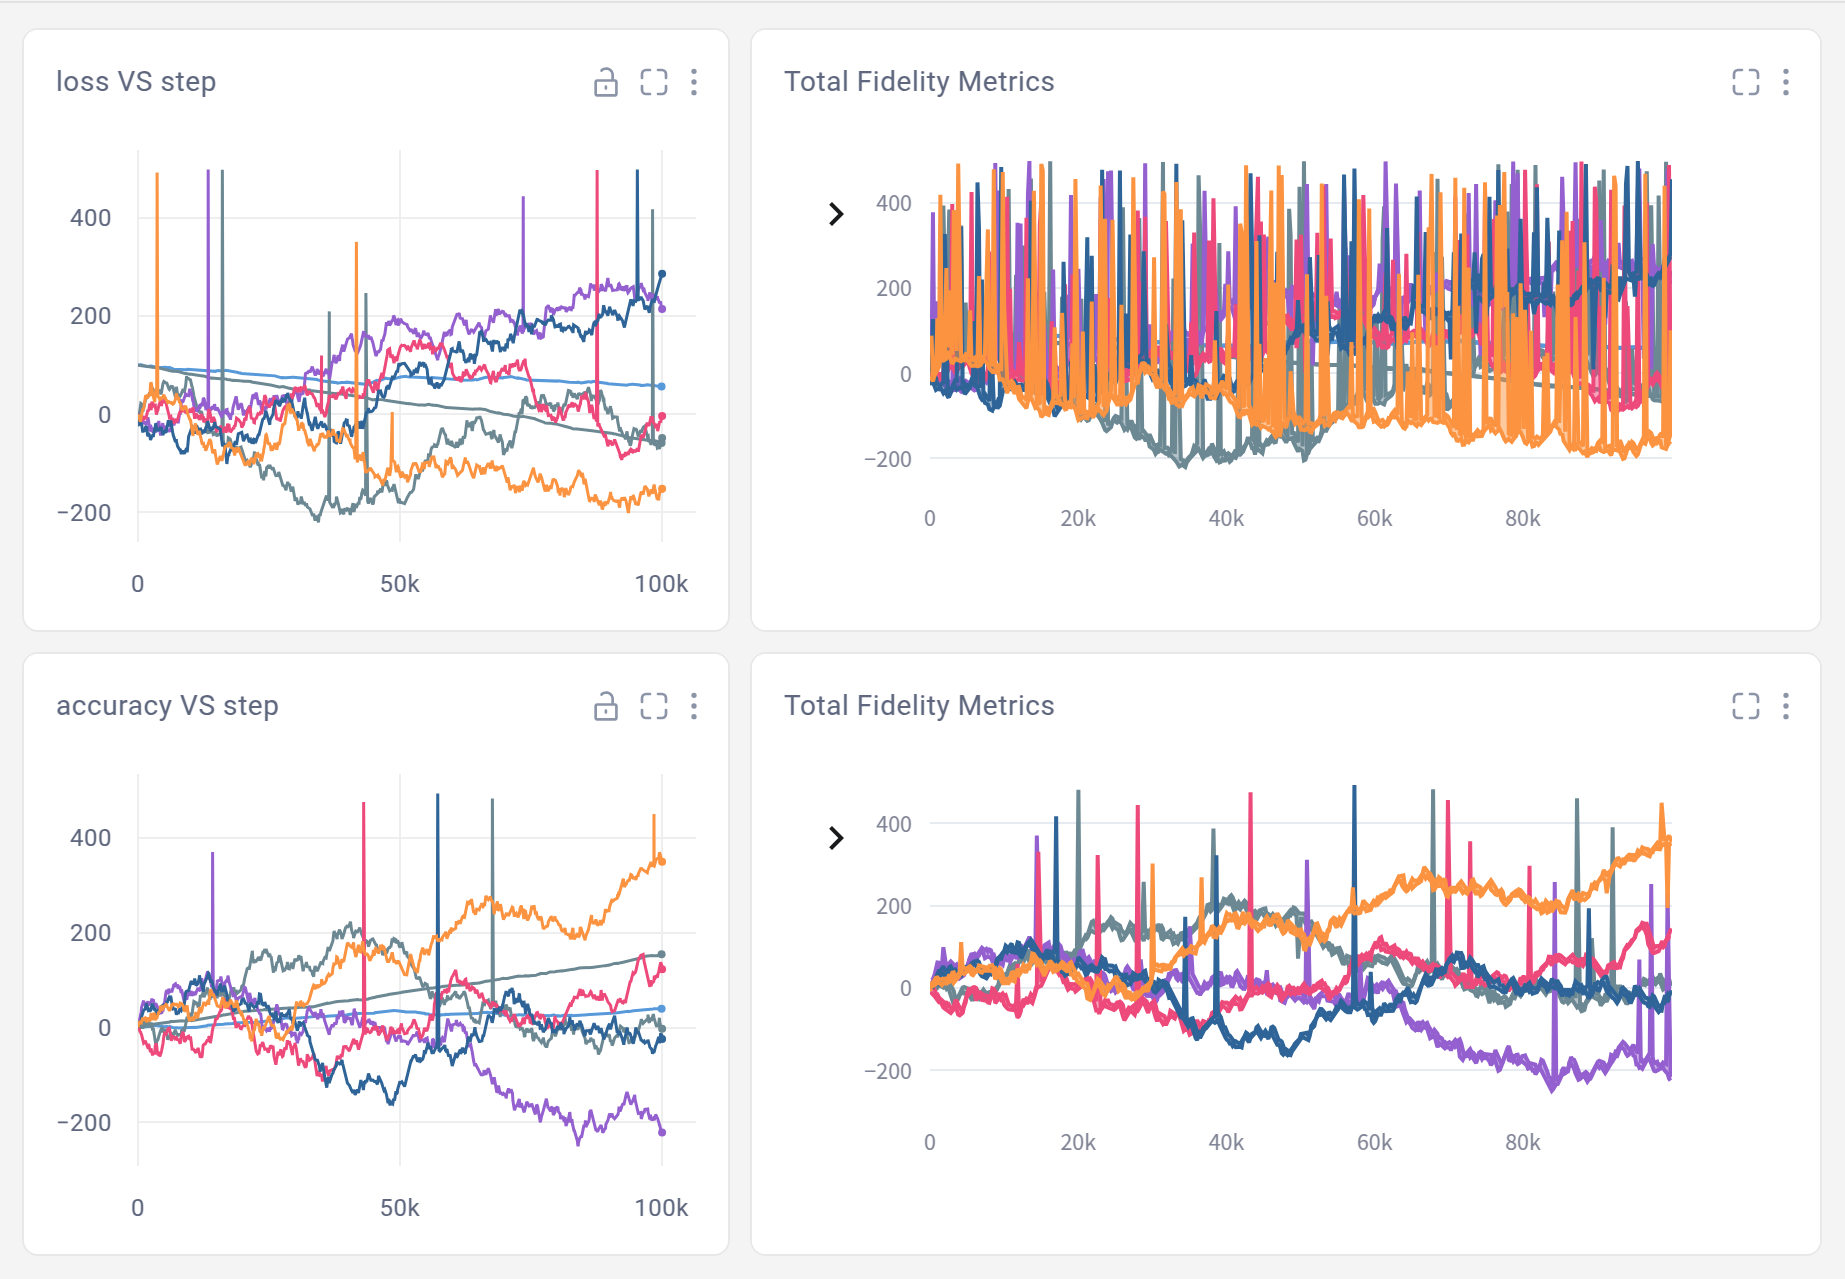
Long training runs with are becoming increasingly common, and with them the need to store millions of metric values for each experiment. The detail remains important – such as the ability to see all outliers, and to inspect how fast the loss recovers. Total fidelity metrics allow you to view this level of detail without any sampling.
Enabling total fidelity
You can enable the setting "Store metrics without sampling" in your Organization settings in the Admin dashboard.
Working with total fidelity data
When the setting is enabled, in addition to storing sampled metrics in the database for fast access, Comet will also store them as compressed CSV files in the Experiment Assets.
No changes are needed in your tracking code, you can continue to use the normal SDK methods, API or integrations to log all metrics.
Most of the application features, such as built-in line charts or filters will still use the sampled metrics for fast performance.
In order to explore the total fidelity metrics, you can visualize them using a Python panel, or fetch the full data using the SDK.
Retrieving the data with SDK
To retrieve Total Fidelity metrics, you use the method:
df = APIExperiment.get_metric_total_df("loss")
The returned Pandas DataFrame contains the following columns:
- value - the value of the metric
- timestep - the time of the metric
- step - the step that the metric was logged at
- epoch - the epoch that the metric was logged at
- datetime - the timestamp as a datetime
- duration - the duration time between this row and the previous
Read more in the SDK documentation.
Visualizing the data using a Python panel
In order to preview the total fidelity data in your project or experiment views, you can use a Python panel.
You can either use one that was prepared by Comet, or you can easily modify it to suit your needs.