Skip to content

Log 3d point clouds

Comet's 3d point clouds represent spatial information in three dimensions through a collection of points, sometimes accompanied by color information.
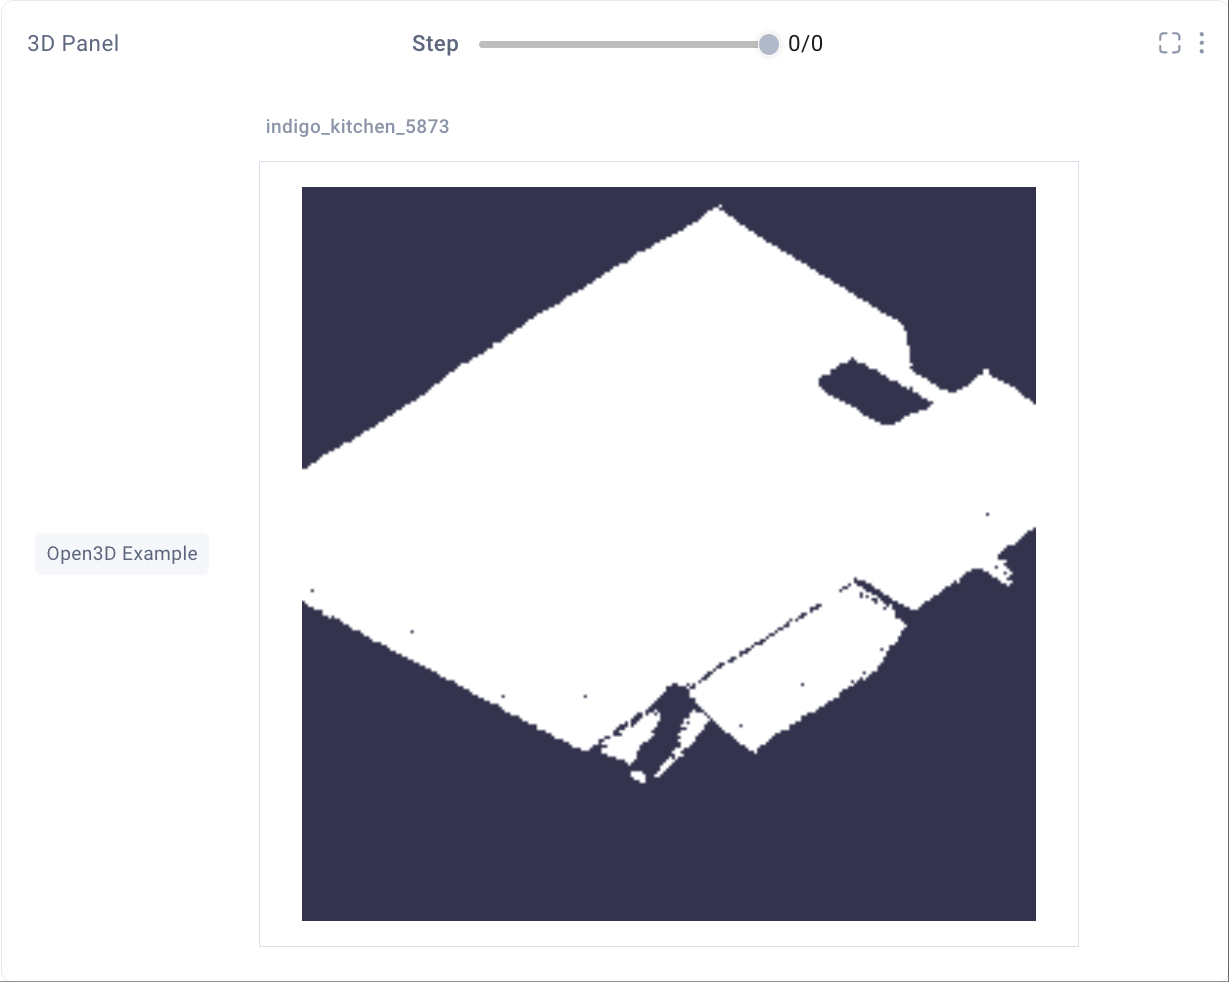
Example 3d Panel
Examples of 3d point clouds rendered in the Comet UI

Comet allows you to create scenes with millions of 3d points that you can visually inspect through advanced functionalities such as zooming, panning, and more. Alternatively to points, you can visualize boxes which are useful when working on segmentation tasks with 3d data.

The following methods can be used to log 3D point clouds:

The following panel can be used to visualize 3D point clouds:

In addition all 3D point clouds logged to an Experiment can be viewed in the Single Experiment page tab:

For example, you could...

Evaluate the performance of models trained on 3d data by logging point clouds alongside model predictions and visually inspect the alignment between predicted and ground truth object positions.

Log with points

The example below logs one 3d cloud defined as a points list using the open3d library.

 1
 2
 3
 4
 5
 6
 7
 8
 9
10
11
12
13
14
15
16
17
18
19
import comet_ml
import numpy as np
import open3d as o3d

# Initialize the Comet Experiment
comet_ml.login()
exp = comet_ml.Experiment()

# Create an example 3d points cloud
dataset = o3d.data.PCDPointCloud()
pcd = o3d.io.read_point_cloud(dataset.path)
points = np.asarray(pcd.points).tolist()

# Log the 3d points cloud to Comet
exp.log_points_3d(
    scene_name="Open3D Example",
    points=points,
    step=0,
)

The points argument takes a list of points, where each point is defined as an [X, Y , Z] vector.

You can optionally specify the color for a point by using the [X, Y, Z, R, G, B] format, where R, G and B should take a value in [0, 255].

Log with boxes

The example below logs 100 boxes of equal size, and assigns a random label (and color) to each.

 1
 2
 3
 4
 5
 6
 7
 8
 9
10
11
12
13
14
15
16
17
18
19
20
21
22
23
24
25
26
27
28
29
30
31
32
33
34
35
36
37
38
39
40
41
42
43
44
45
46
47
48
49
50
51
52
53
54
55
56
57
58
59
import comet_ml
import random

# Initialize the Comet Experiment
comet_ml.login()
exp = comet_ml.Experiment()

# Create 100 example 3d boxes with four different colored labels
color = {
    "cat": [255, 0, 0],
    "dog": [0, 255, 0],
    "car": [0, 0, 255],
    "bicycle": [128, 128, 0],
}
box_size = 5
boxes = []
for i in range(100):
    # Pick a (x, y, z) point in 3D space and assign it a random label
    p = [random.randint(0, 100) for v in range(3)]
    label = random.choice(list(color.keys()))
    box = {
        # A box is composed of segments (lines), where the point order matters.
        # Define four corners in the 3D space of a cube
        "segments": [
            # Top:
            [
                (p[0], p[1], p[2]),
                (p[0] + box_size, p[1], p[2]),
                (p[0] + box_size, p[1] + box_size, p[2]),
                (p[0], p[1] + box_size, p[2]),
                (p[0], p[1], p[2]),
            ],
            # Bottom:
            [
                (p[0], p[1], p[2] + box_size),
                (p[0] + box_size, p[1], p[2] + box_size),
                (p[0] + box_size, p[1] + box_size, p[2] + box_size),
                (p[0], p[1] + box_size, p[2] + box_size),
                (p[0], p[1], p[2] + box_size),
            ],
            # Edges, top to bottom:
            [(p[0], p[1], p[2]), (p[0], p[1], p[2] + box_size)],
            [(p[0] + box_size, p[1], p[2]), (p[0] + box_size, p[1], p[2] + box_size)],
            [(p[0] + box_size, p[1] + box_size, p[2]), (p[0] + box_size, p[1] + box_size, p[2] + box_size)],
            [(p[0], p[1] + box_size, p[2]), (p[0], p[1] + box_size, p[2] + box_size)],
        ],
        "score": random.random(),
        "name": random.choice(["Prediction", "Truth"]),
        "label": label,
        "color": color[label],
    }
    boxes.append(box)

# Log the 3d boxes to Comet
exp.log_points_3d(
    scene_name="3D Boxes Example",
    boxes=boxes,
    step=0,
)

The boxes argument takes a list of boxes. Each box is defined as a dictionary with the following entries:

1
2
3
4
5
6
7
{
    "segments": list,  # [[[x, y, z], ...], ...]
    "name": str,
    "color": [int, int, int],  # each RGB value in [0, 255]
    "score": float, # in [0, 1]
    "label": str,
}

where only segments and name are required.

Sep. 12, 2024