Curated Custom Python Panels
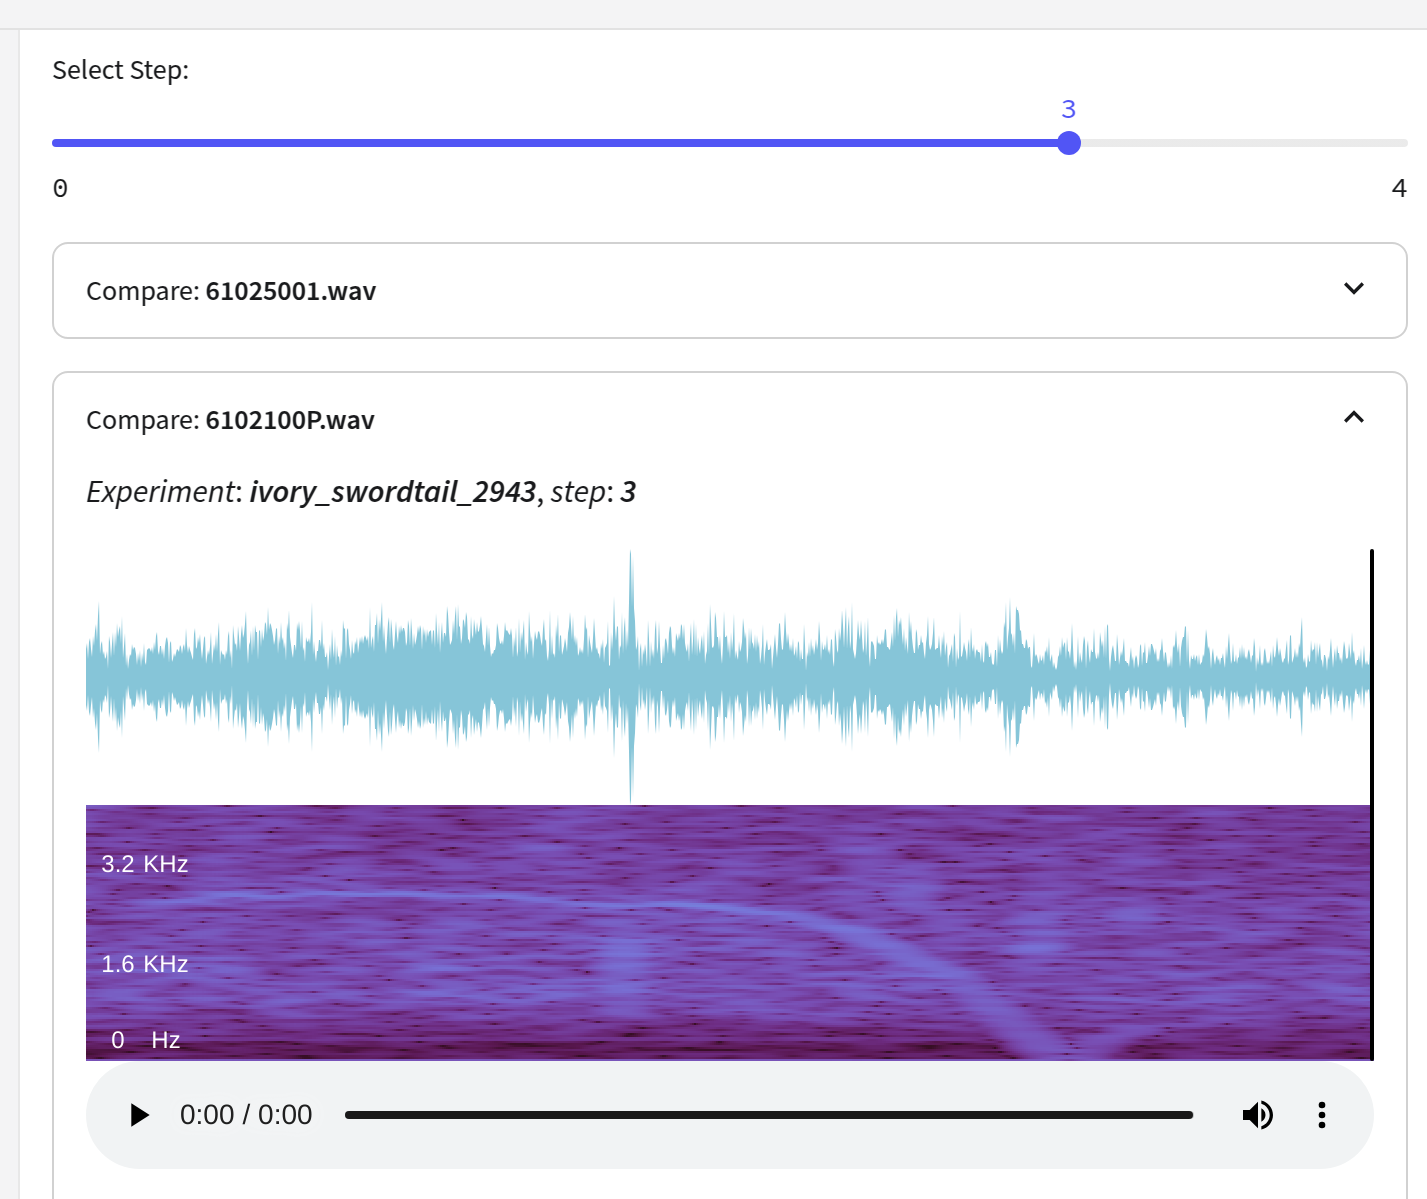
AudioCompare
The AudioCompare panel is used to examine audio waveforms and spectrograms in a single experiment or across experiments. See also the built-in Audio Panel.
 |  |
For more information, see the panel README.md
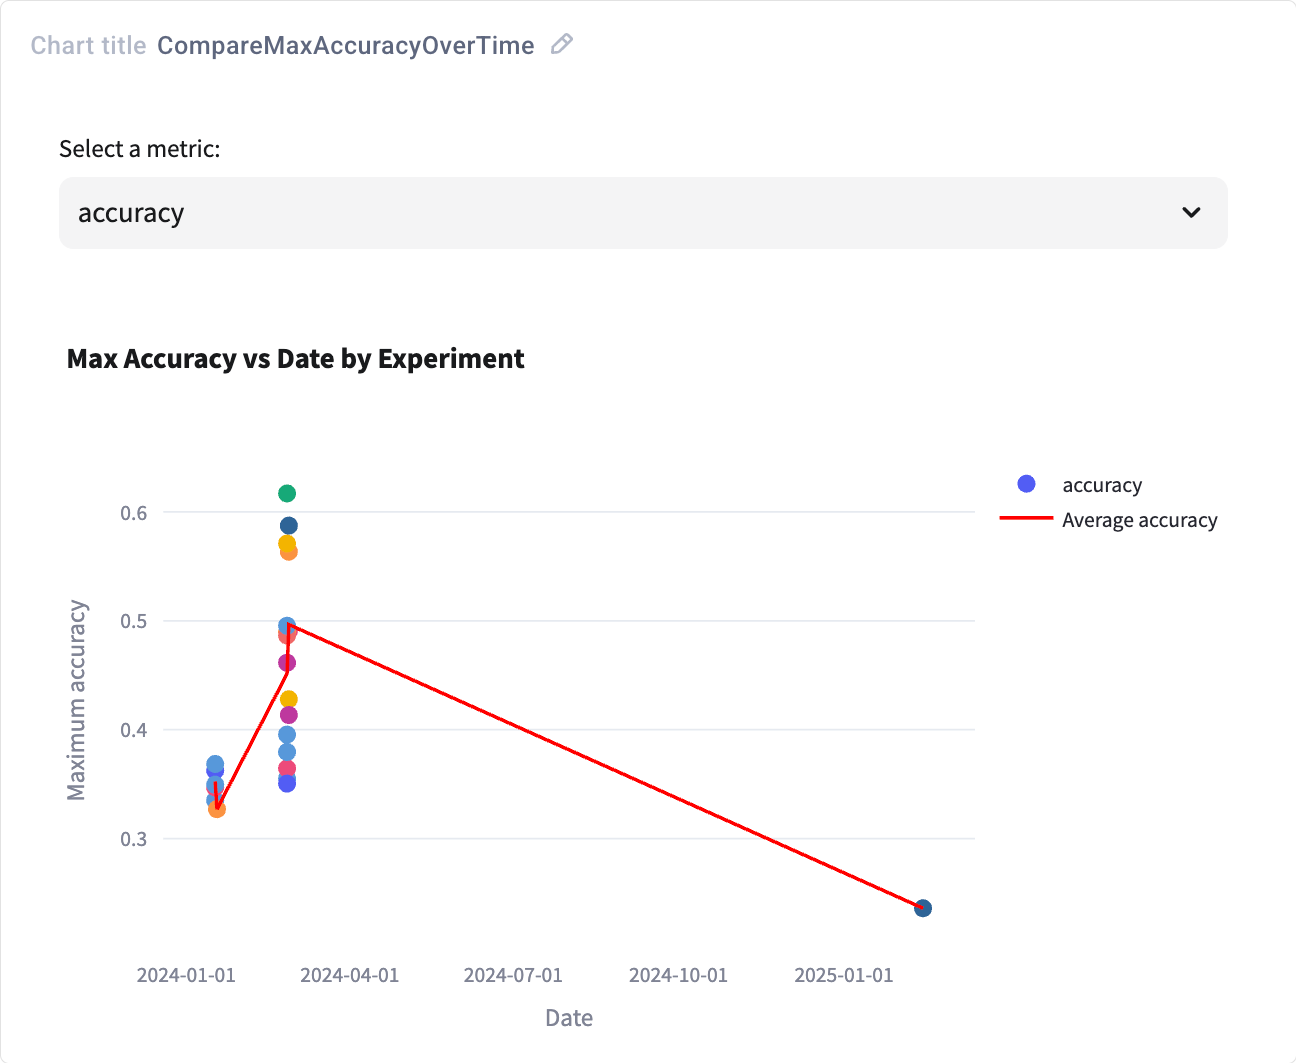
CompareMaxAccuracyOverTime
The CompareMaxAccuracyOverTime panel is used to help track how the retraining of a model each week compares to the previous week. This panel creates a scatter plot of the max average of a metric (of your choosing) over time.
 |
For more information, see the panel README.md
DataGridViewer
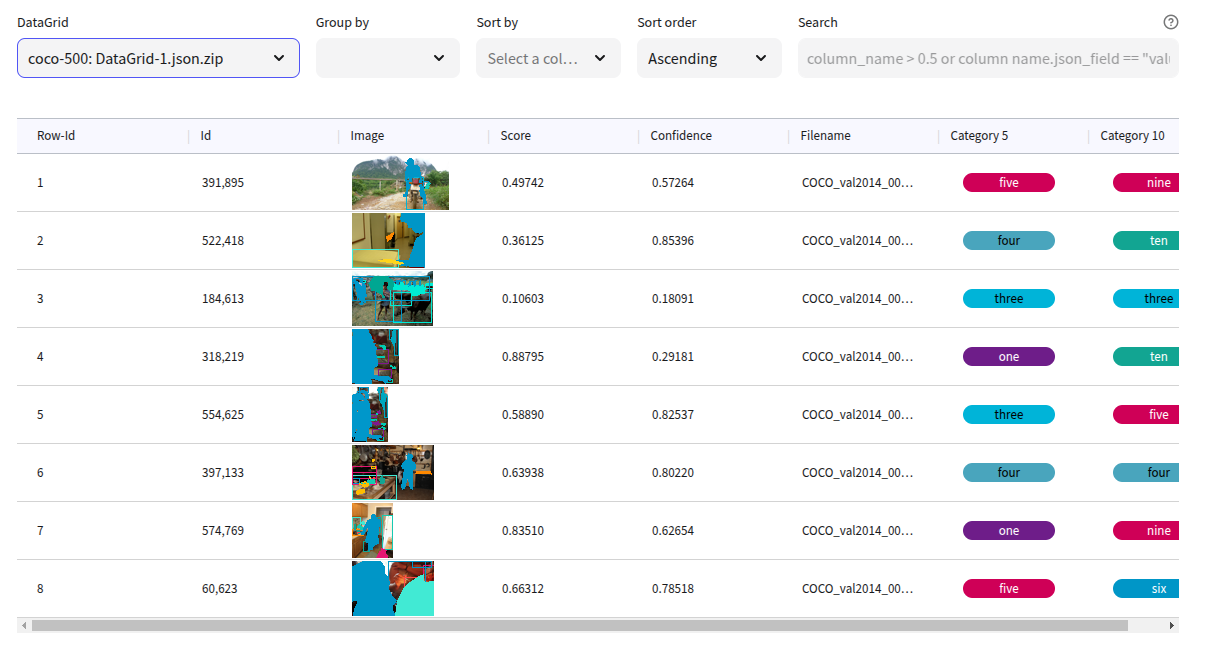
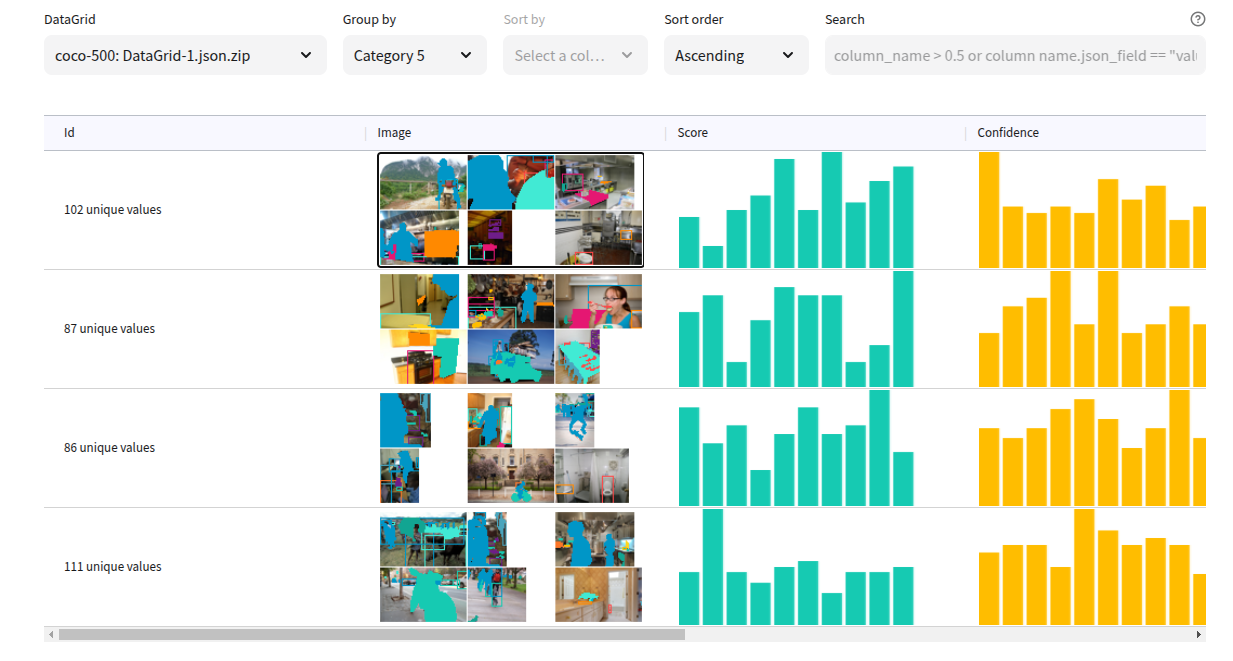
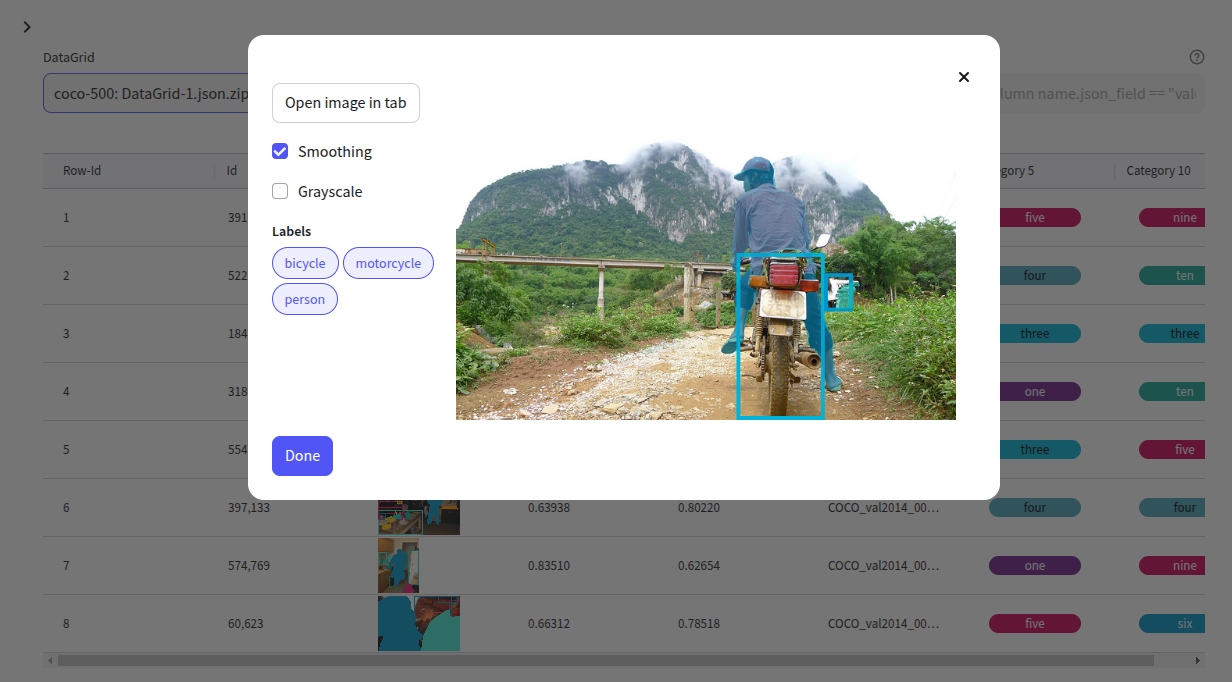
The DataGridViewer panel is used to visualize Comet DataGrids which can contain Images, text, and numeric data.
The UX is a sophisticated approach to grouping data to see (and select) images and other data in a tabular format, with a search feature that allows fast querying of the data (including metadata) using Python syntax.
 |  |  |
For more information, see the panel README.md
MetricsByStep
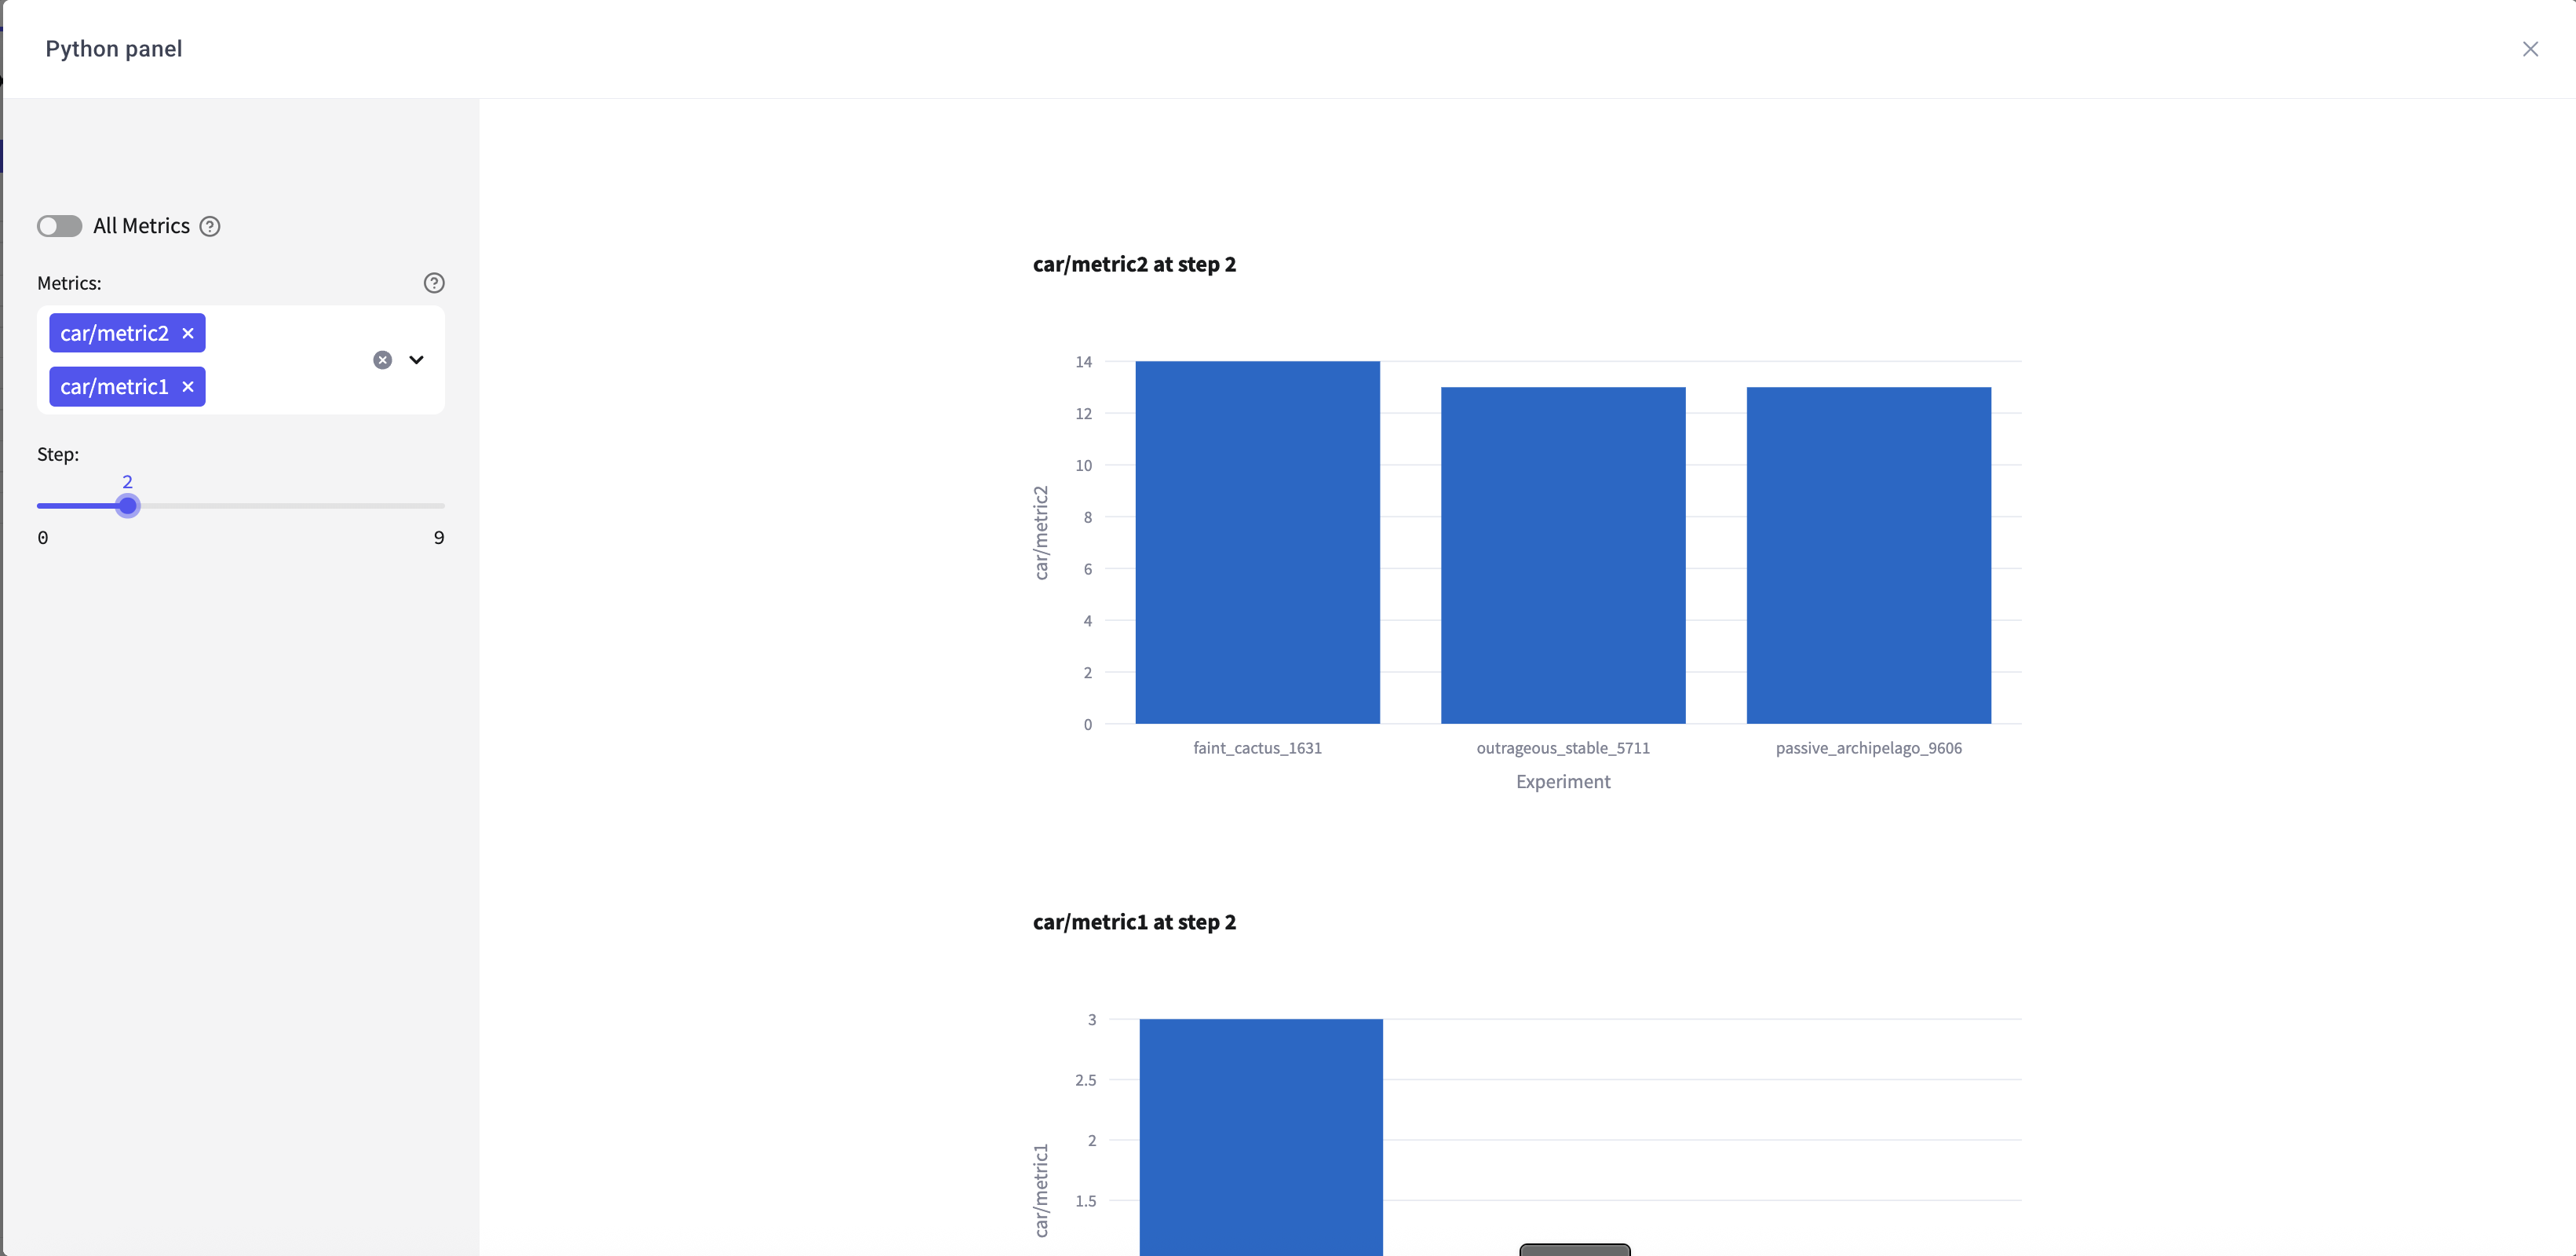
The MetricsByStep panel is used to compare the value of your metrics at a specific step across all of your experiments using bar charts.
 |
For more information, see the panel README.md
ModelCheckpointComparison
The ModelCheckpointComparison panel is used to compare performance of your model at each of the checkpoints logged. This is a useful tool to help determine which of your model checkpoints is best performing and should be promoted via the registry.
 |
First, run your experiment, including logging the model checkpoints and metrics at each step/epoch in your training loop. Each model checkpoint should log the step or epoch to the metadata field, and be uniquely named based on step/epoch, so that the panel can later match each checkpoint to performance at that step/epoch.
#Log the model checkpoint directly to Comet at each epoch
for i in range(10):
    experiment.log_model(f'checkpoint_{i}', '/path/to/your/model.pkl', metadata = {'epoch': i})
    experiment.log_metric('metric1', i, epoch=i)
    experiment.log_metric('metric2', 50-i, epoch=i)


#Or log a pointer to the model checkpoint at each epoch
for i in range(10):
    experiment.log_remote_model(f'checkpoint_{i}', '/path/to/your/model.pkl', metadata = {'epoch': i})
    experiment.log_metric('metric1', i, epoch=i)
    experiment.log_metric('metric2', 50-i, epoch=i)
For more information, see the panel README.md
ncu-rep Viewer
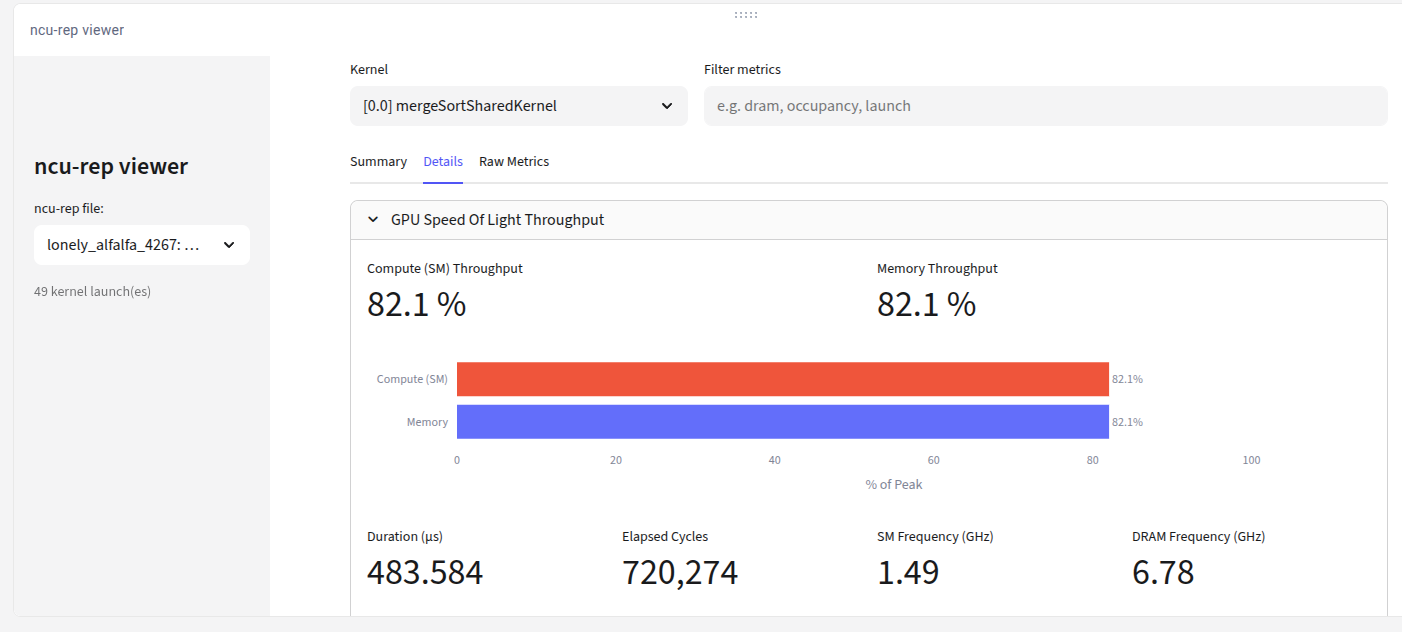
This Python Panel is a viewer for NVIDIA Nsight Compute profiler reports (.ncu-rep files) that teams have logged as experiment assets. It turns those raw GPU-kernel profiles into an interactive, Nsight-style dashboard right inside the Comet UI.
 |
from comet_ml import start

experiment = start(
  api_key="YOUR-API-KEY",
  project_name="ncu-rep-viewer",
  workspace="YOUR-WORKSPACE"
)

# examples:
experiment.log_asset("manual_nvtx.ncu-rep")
experiment.log_asset("CuVectorAddDrv.ncu-rep")
experiment.log_asset("mergeSort.ncu-rep")

experiment.end()
For more information, see the panel README.md
NotebookViewer
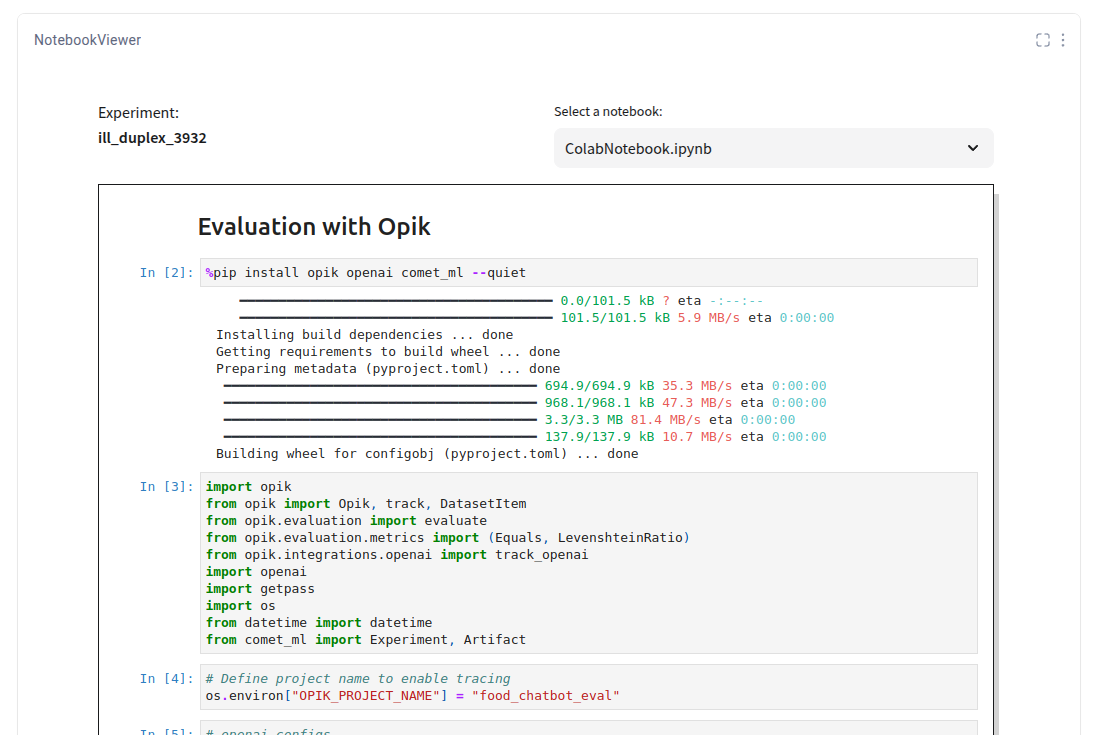
The NotebookViewer panel is used to render logged Notebooks, either from colab.research.google.com or any Jupyter Notebook.
Comet will automatically log your Colab notebooks, both as a full history of commenads as `Code.ipynb', but also as a completed notebook with images and output. For Jupyter, you can use our cometx config --auto-log-notebook yes
 |
For more information, see the panel README.md
OptimizerAnalysis
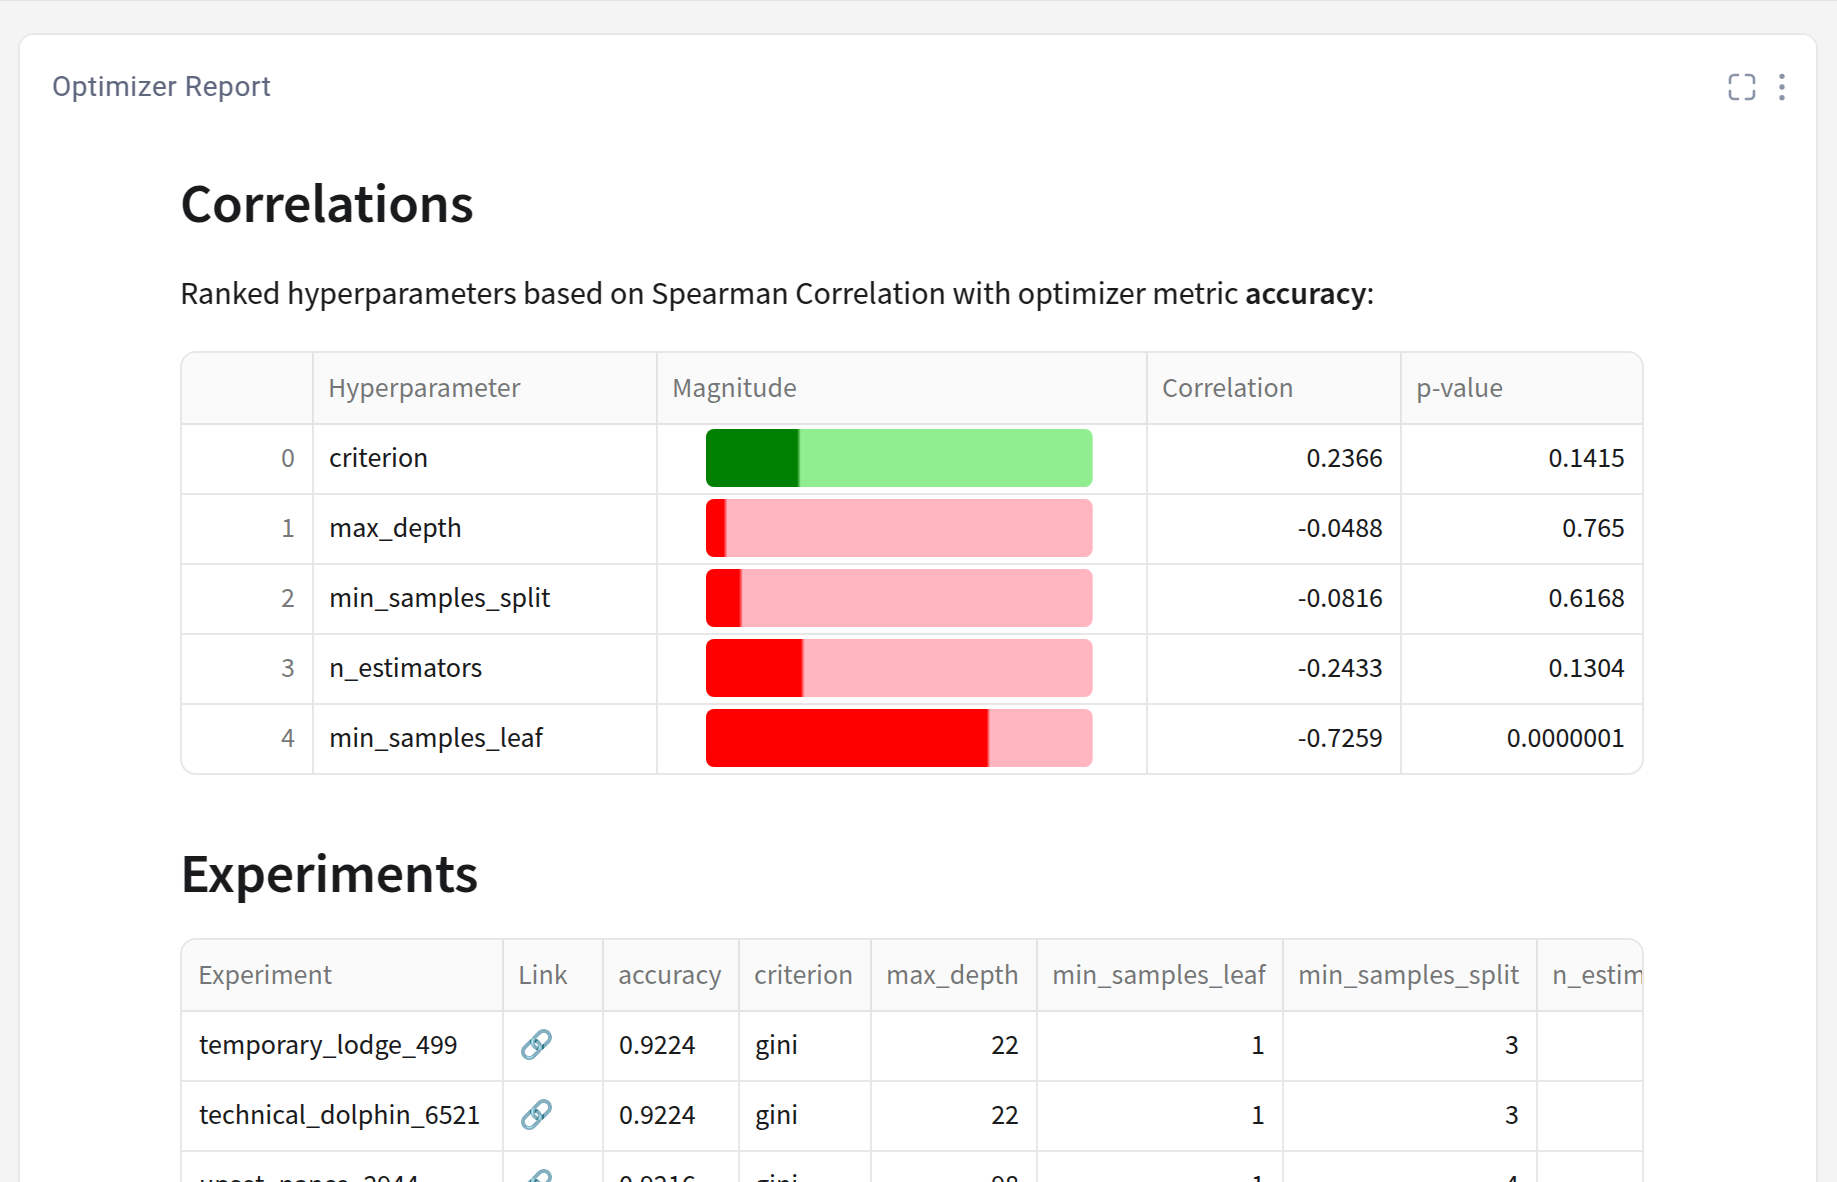
The OptimizerAnalysis panel is used to explore results from an Optimizer Search or Sweep. The Comet Optimizer is used to dynamically find the best set of hyperparameter values that will minimize a Hyper Parameter Optimization tool (HPO) that can be used to maximize a particular metric. The OptimizerAnalysis panel, combined with the Parallel Coordinate Chart allows detailed exploration of the results from your grid search or sweep.
 |
For more information, see the panel README.md
SaveModelAsArtifact
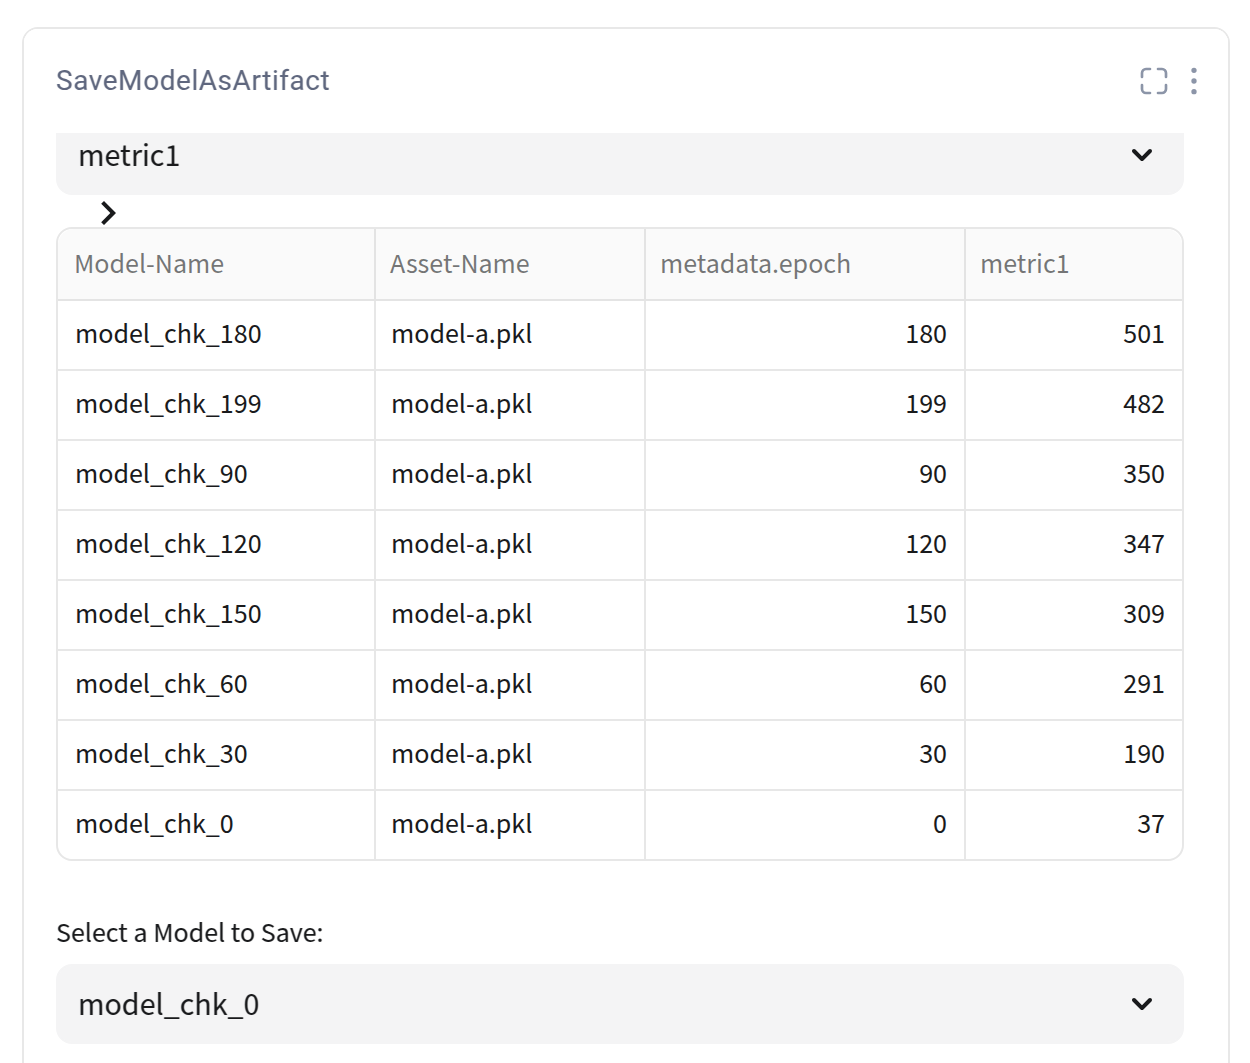
This panel allows you to save a model as an artifact. Adding metadata to the model when you log it allows examination, and saving, by epoch. You can either create a new Artifact, or use an existing artifact name.
 |
For more information, see the panel README.md
TensorboardGroupViewer
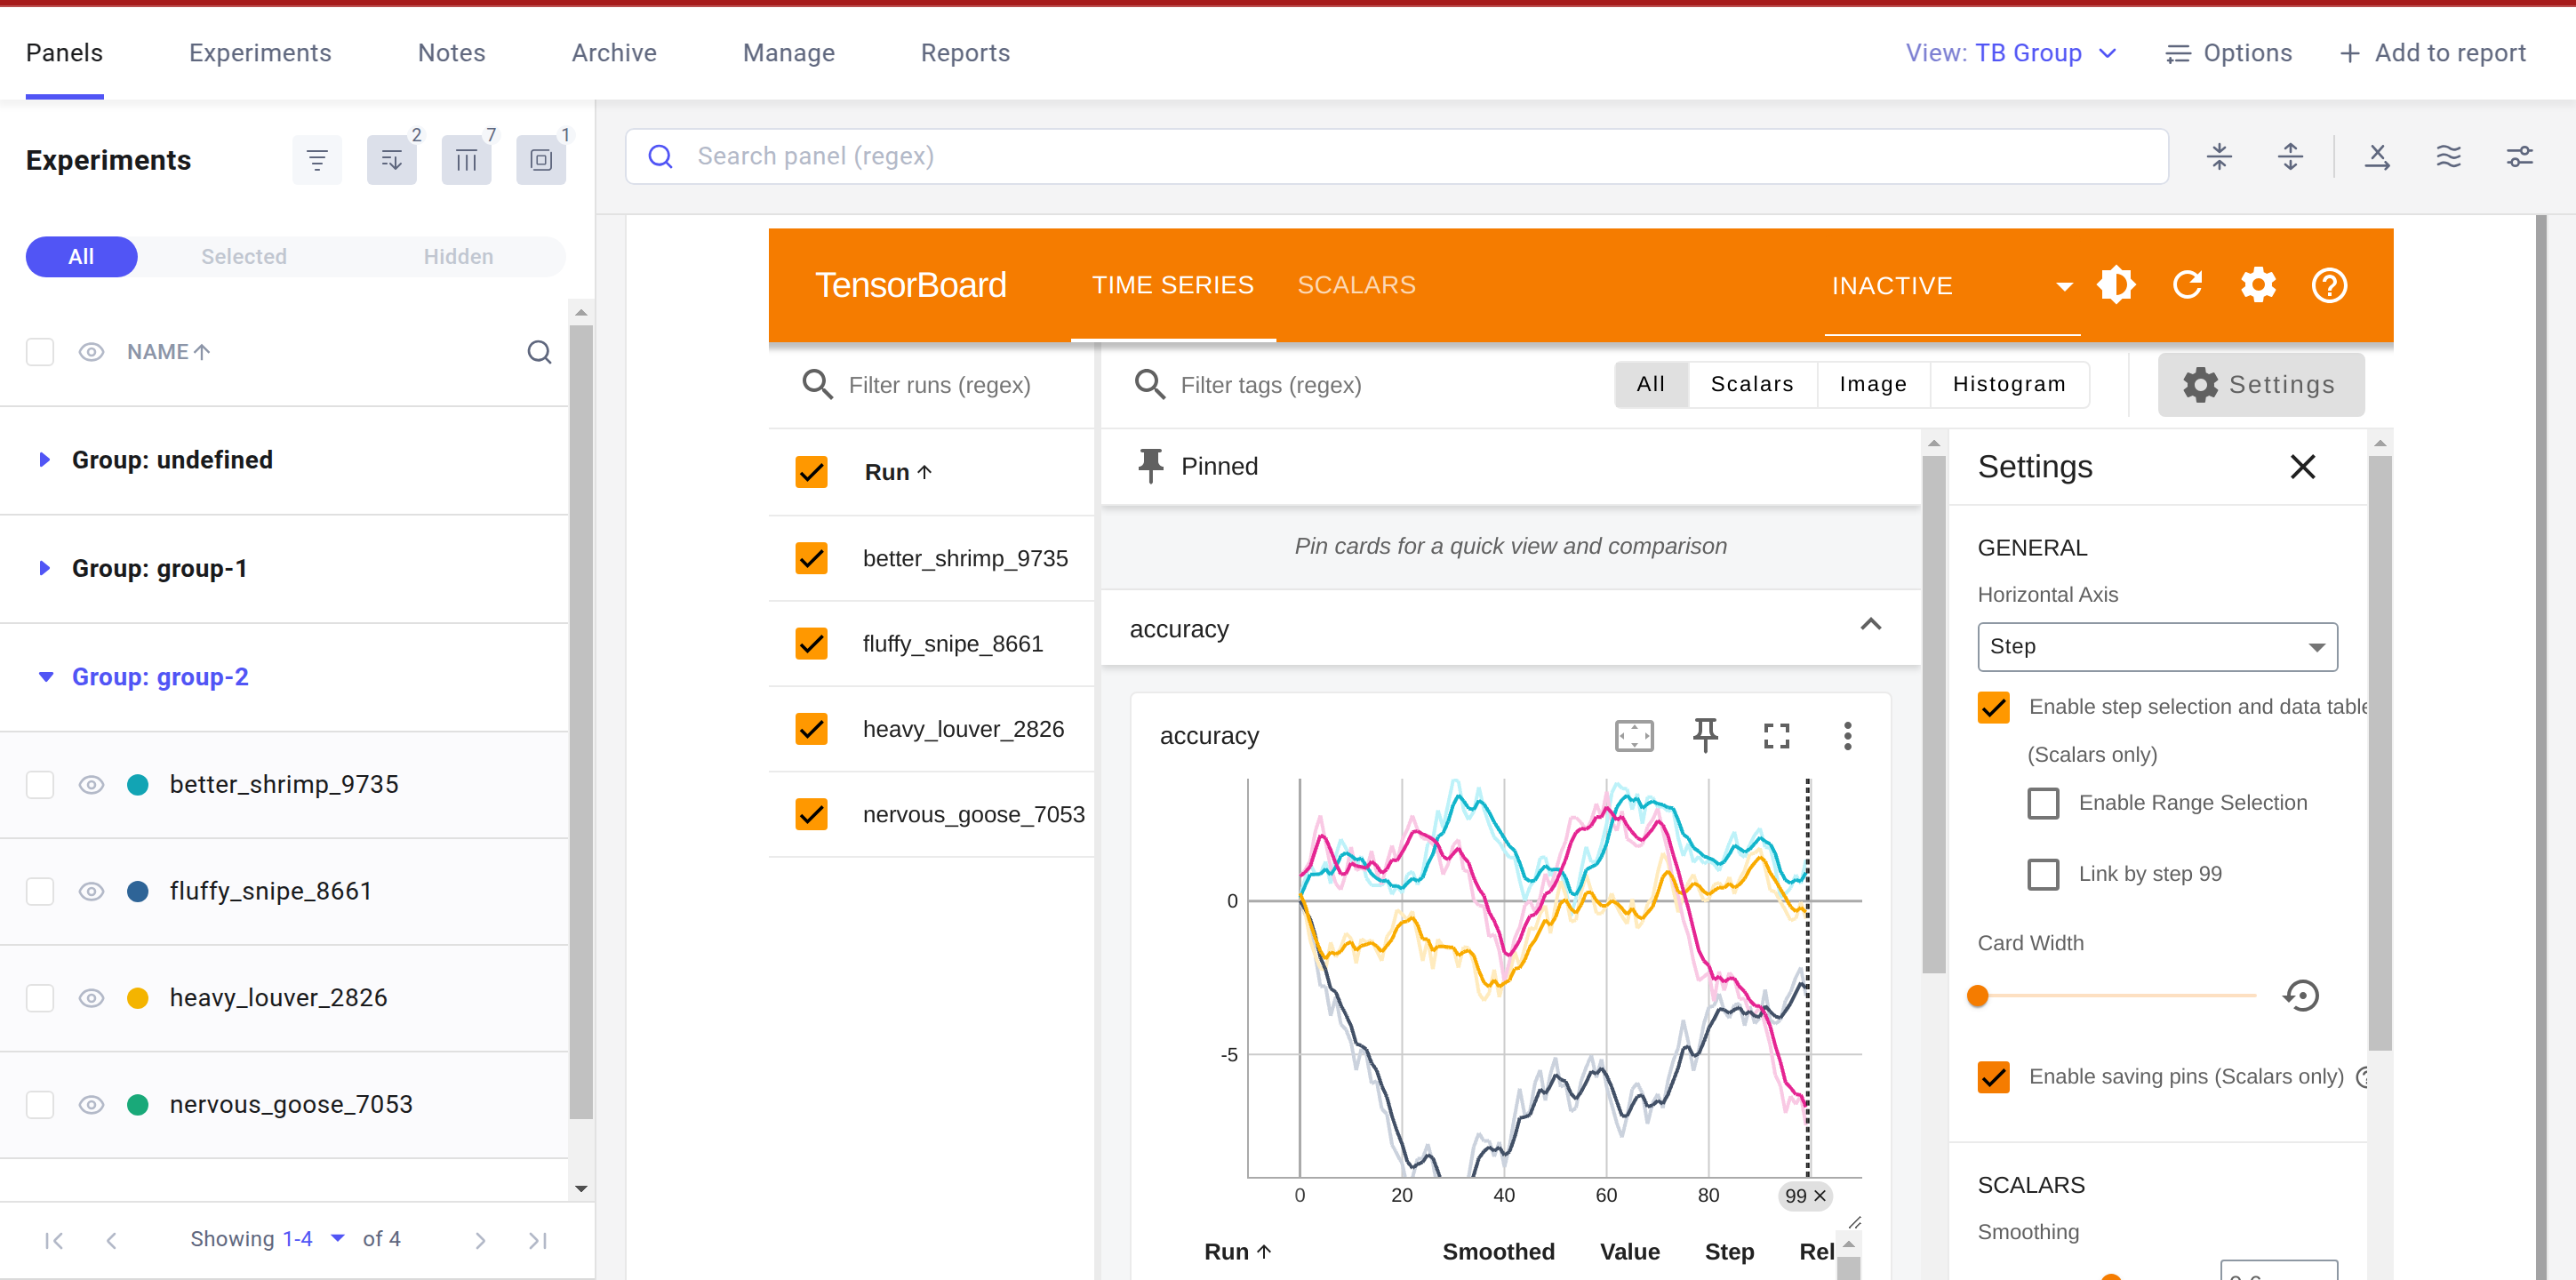
The TensorboardGroupViewer panel is used to visualize Tensorboard-logged items inside a Comet Custom Panel, by grouping. This panel specifically is used to see a group of experiments' log folders.
 |
First, run your experiment, including writing and logging the Tensorboard log folder:
# Set up your experiment
writer = tf.summary.create_file_writer("./logs/%s" % experiment.name)
# Log items, including profile, to writer
# Then, log the folder:
experiment.log_tensorflow_folder("./logs")
Next, in the Comet UI you use the the "Group experiments" option on the left-hand side of the project view. Select the group you'd like to see the profiles. Finally click on "Copy Selected Experiment Logs to Tensorboard Server" in this panel.
For more information, see the panel README.md
TensorboardProfileViewer
The TensorboardProfileViewer panel is used to visualize Tensorboard Profile data logged data inside a Comet Custom Panel.
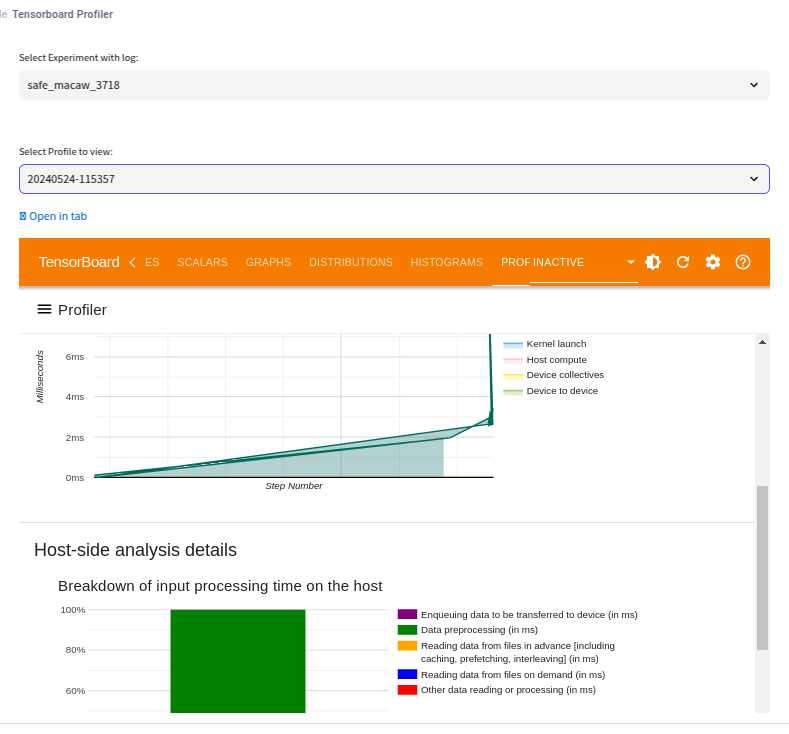 |
First, run your experiment, including writing and logging the Tensorboard logdir:
# Set up your experiment and callbacks:
tboard_callback = tf.keras.callbacks.TensorBoard(
    log_dir=logs,
    histogram_freq=1,
    profile_batch='500,520'
)
model.fit(
    ds_train,
    epochs=2,
    validation_data=ds_test,
    callbacks = [tboard_callback]
)
# Then, log the folder:
experiment.log_tensorflow_folder("./logs")
Finally click on "Select Experiment with log:" in this panel.
For more information, see the panel README.md
TensorboardTorchProfilerViewer
The TensorboardTorchProfilerViewer panel is used to visualize Pytorch Profile data via Tensorboard.
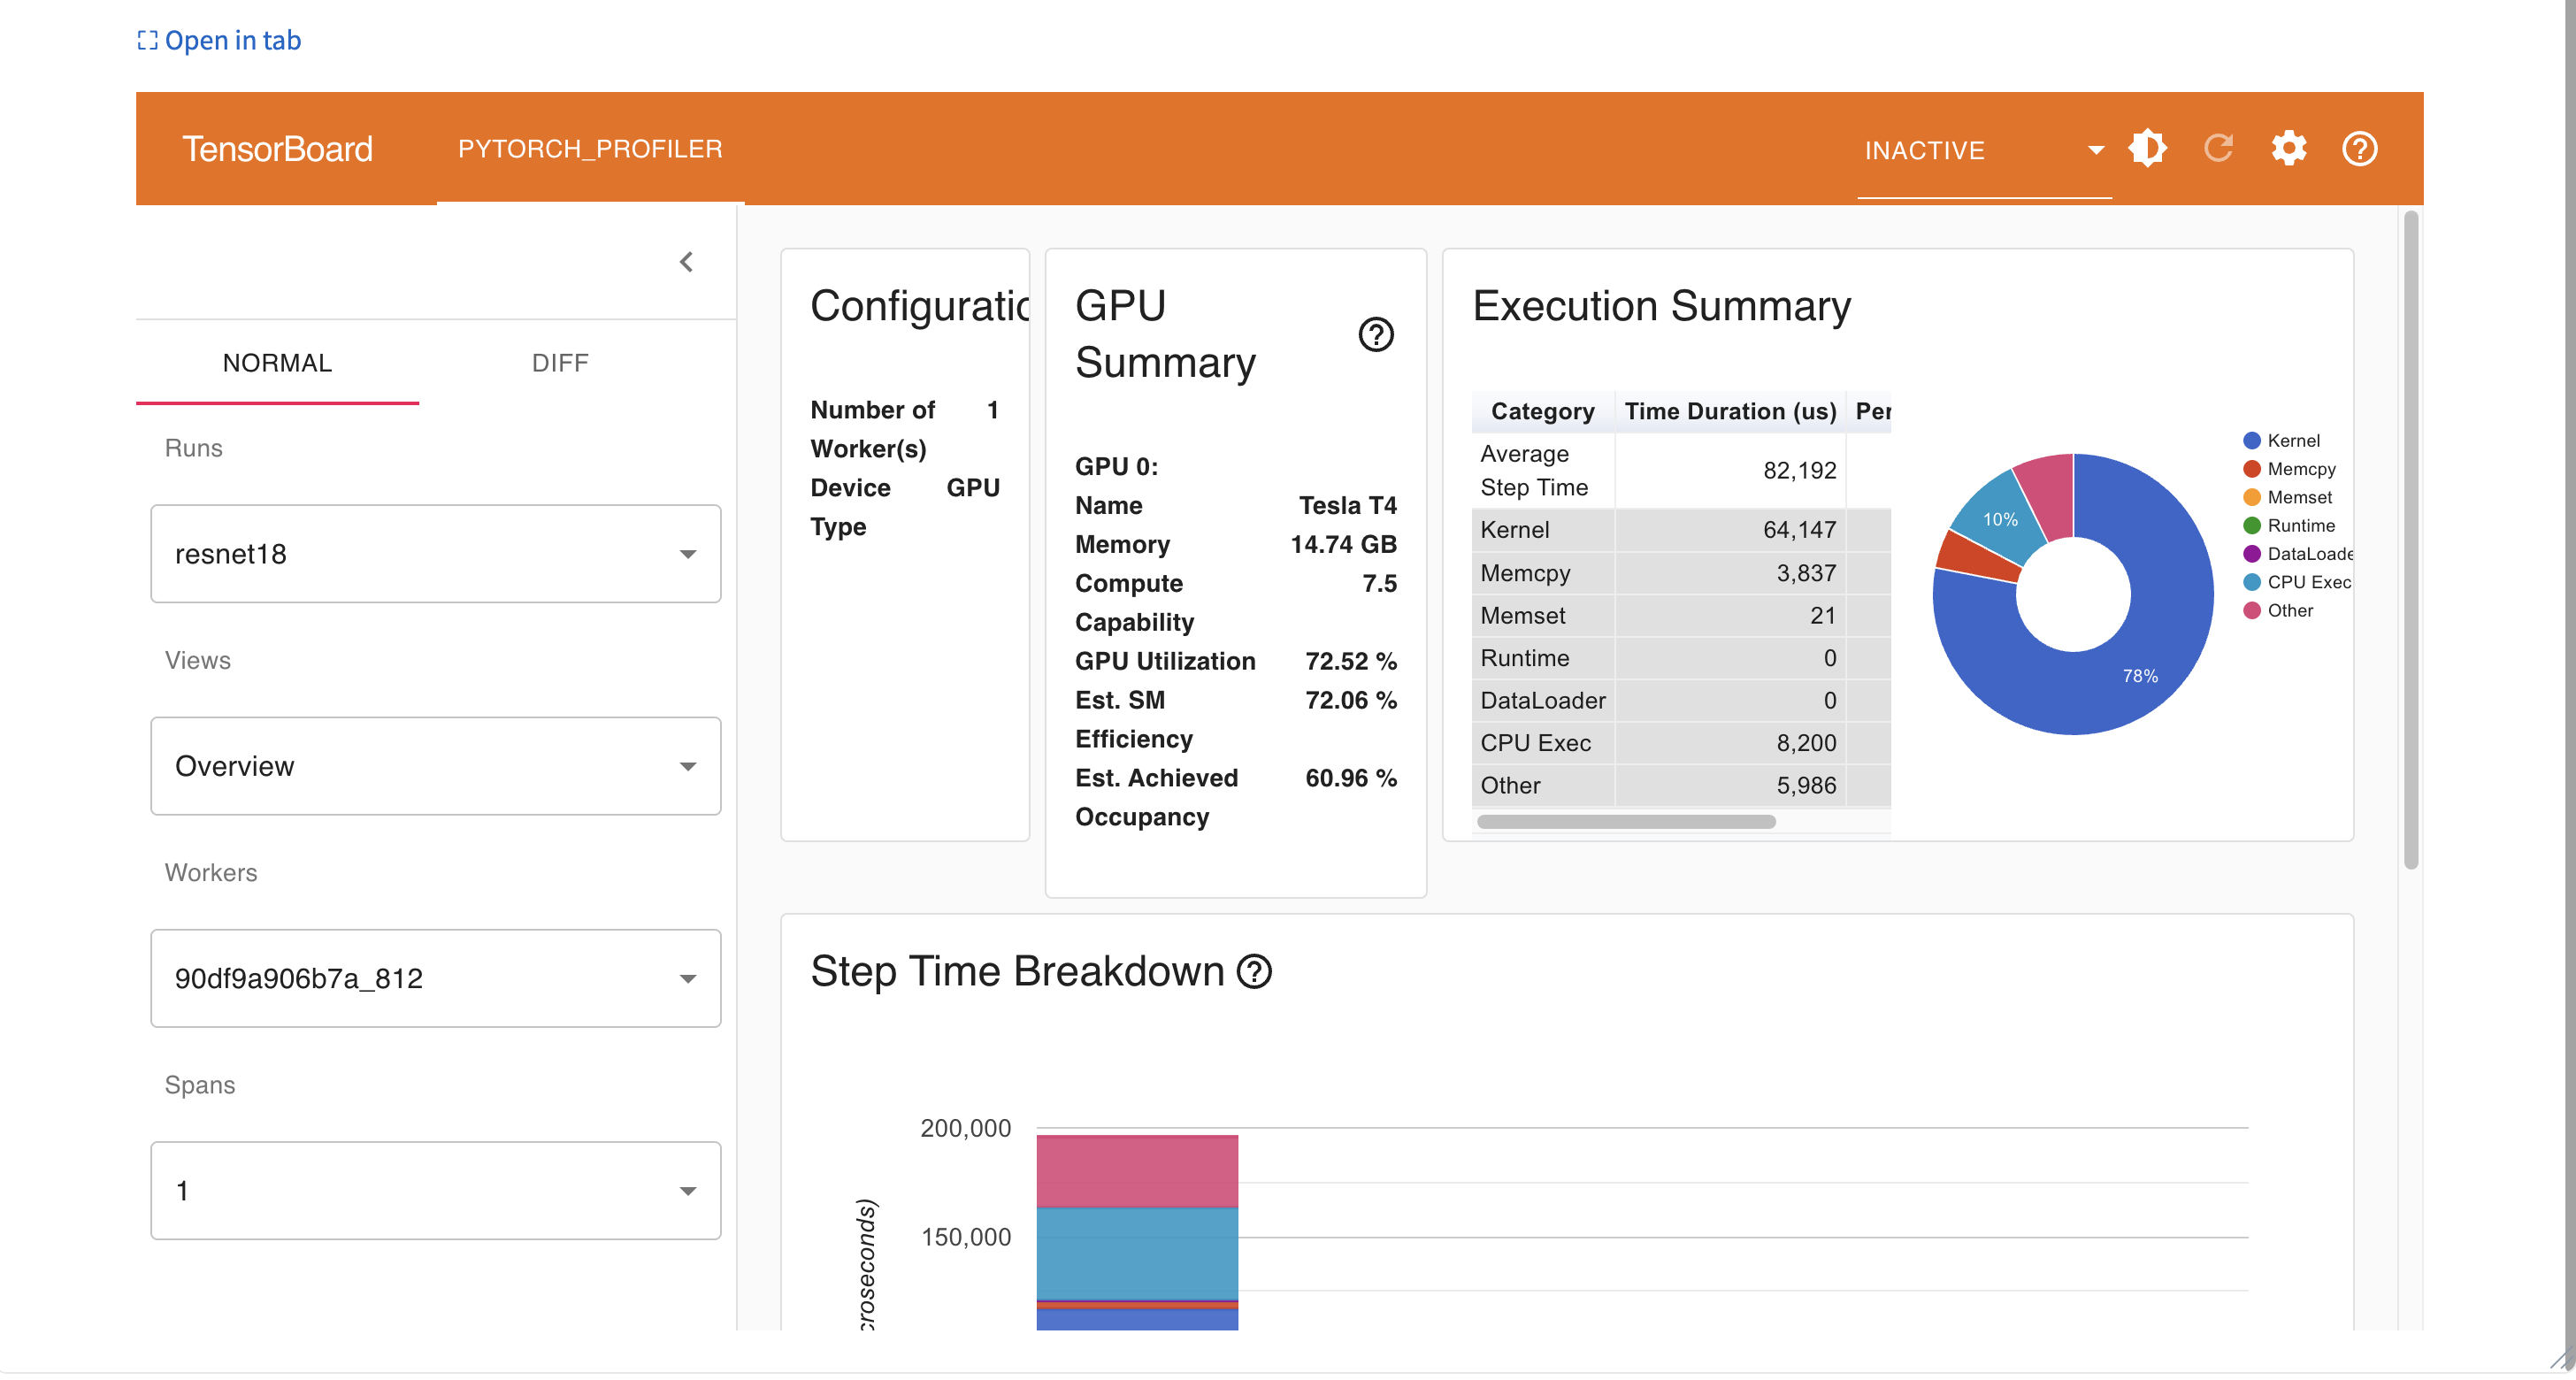 |
First, run your experiment, including writing and logging the Tensorboard logdir:
# Use the PyTorch profiler with trace saving
with torch.profiler.profile(
    activities=[
        torch.profiler.ProfilerActivity.CPU
    ],
    record_shapes=True,
    on_trace_ready=torch.profiler.tensorboard_trace_handler("./logdir")  # Saves trace
) as prof:
    for _ in range(5):
        output = model(input)
        prof.step()  # Important: must call step() in each iteration


#Log the folder to Comet
experiment.log_tensorflow_folder("./logdir")
Finally click on "Select Experiment with log:" in this panel.
For more information, see the panel README.md
TotalFidelityMetricPlot
The TotalFidelityMetricPlot panel is used to plot Total Fidelity Metrics --- metrics that are not sampled in any way.
You can have your Comet Adminstrator turn on "Store metrics without sampling" in the Admin Dashboard => Organization settings.
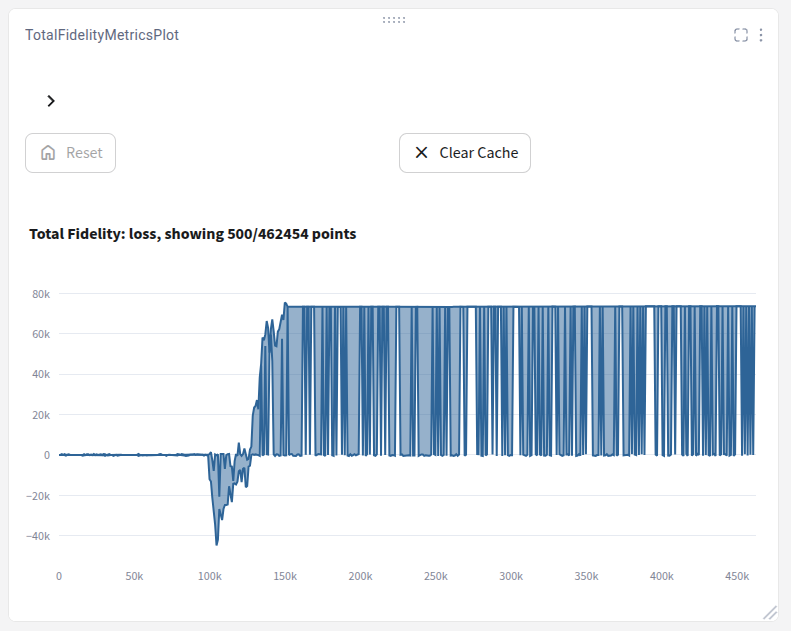 | 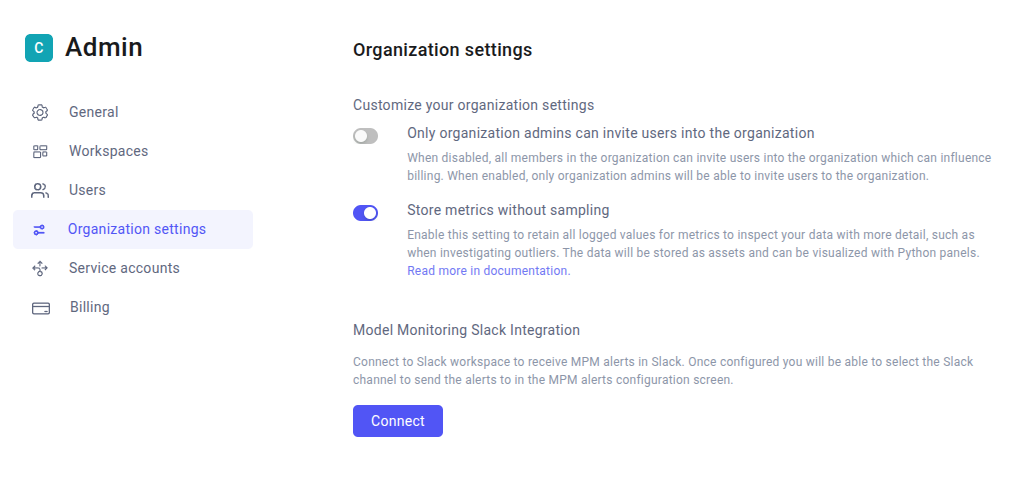 |
For more information, see the panel README.md
Upload panels and build dashboards from code
You can also add these panels to your workspace, and attach them to dashboards, with the Python API in cometx (version 3.6.8 or later). This is useful when you want the same panels and dashboards in many projects or workspaces.
The example below uploads the DataGridViewer panel code and creates a dashboard that contains it:
from cometx import API

api = API()

# Upload the panel code to your workspace
with open("DataGridViewer.py") as fp:
    result = api.upload_panel_code("my-workspace", "DataGridViewer", fp.read())
panel_id = result["templateId"]

# Create a dashboard in a project with the panel
dashboard = api.create_dashboard(
    workspace="my-workspace",
    project_name="my-project",
    template_name="Data Grids",
    panels=[panel_id],
)
To update the panel later, call upload_panel_code() again with template_id=panel_id. The panel is updated in place on all dashboards that use it. Refresh the browser page to see the change.
You can also use upload_panel_zip() to upload a panel zip file, update_dashboard() to rename a dashboard or change its panels, and the cometx.views module to lay out built-in charts, sections, and filters. For more information, see Panels and Dashboards (Python API).