Project Panels page
The Panels page is as a customizable dashboard for your project, and the default page when opening an Experiment Management project in the Comet UI.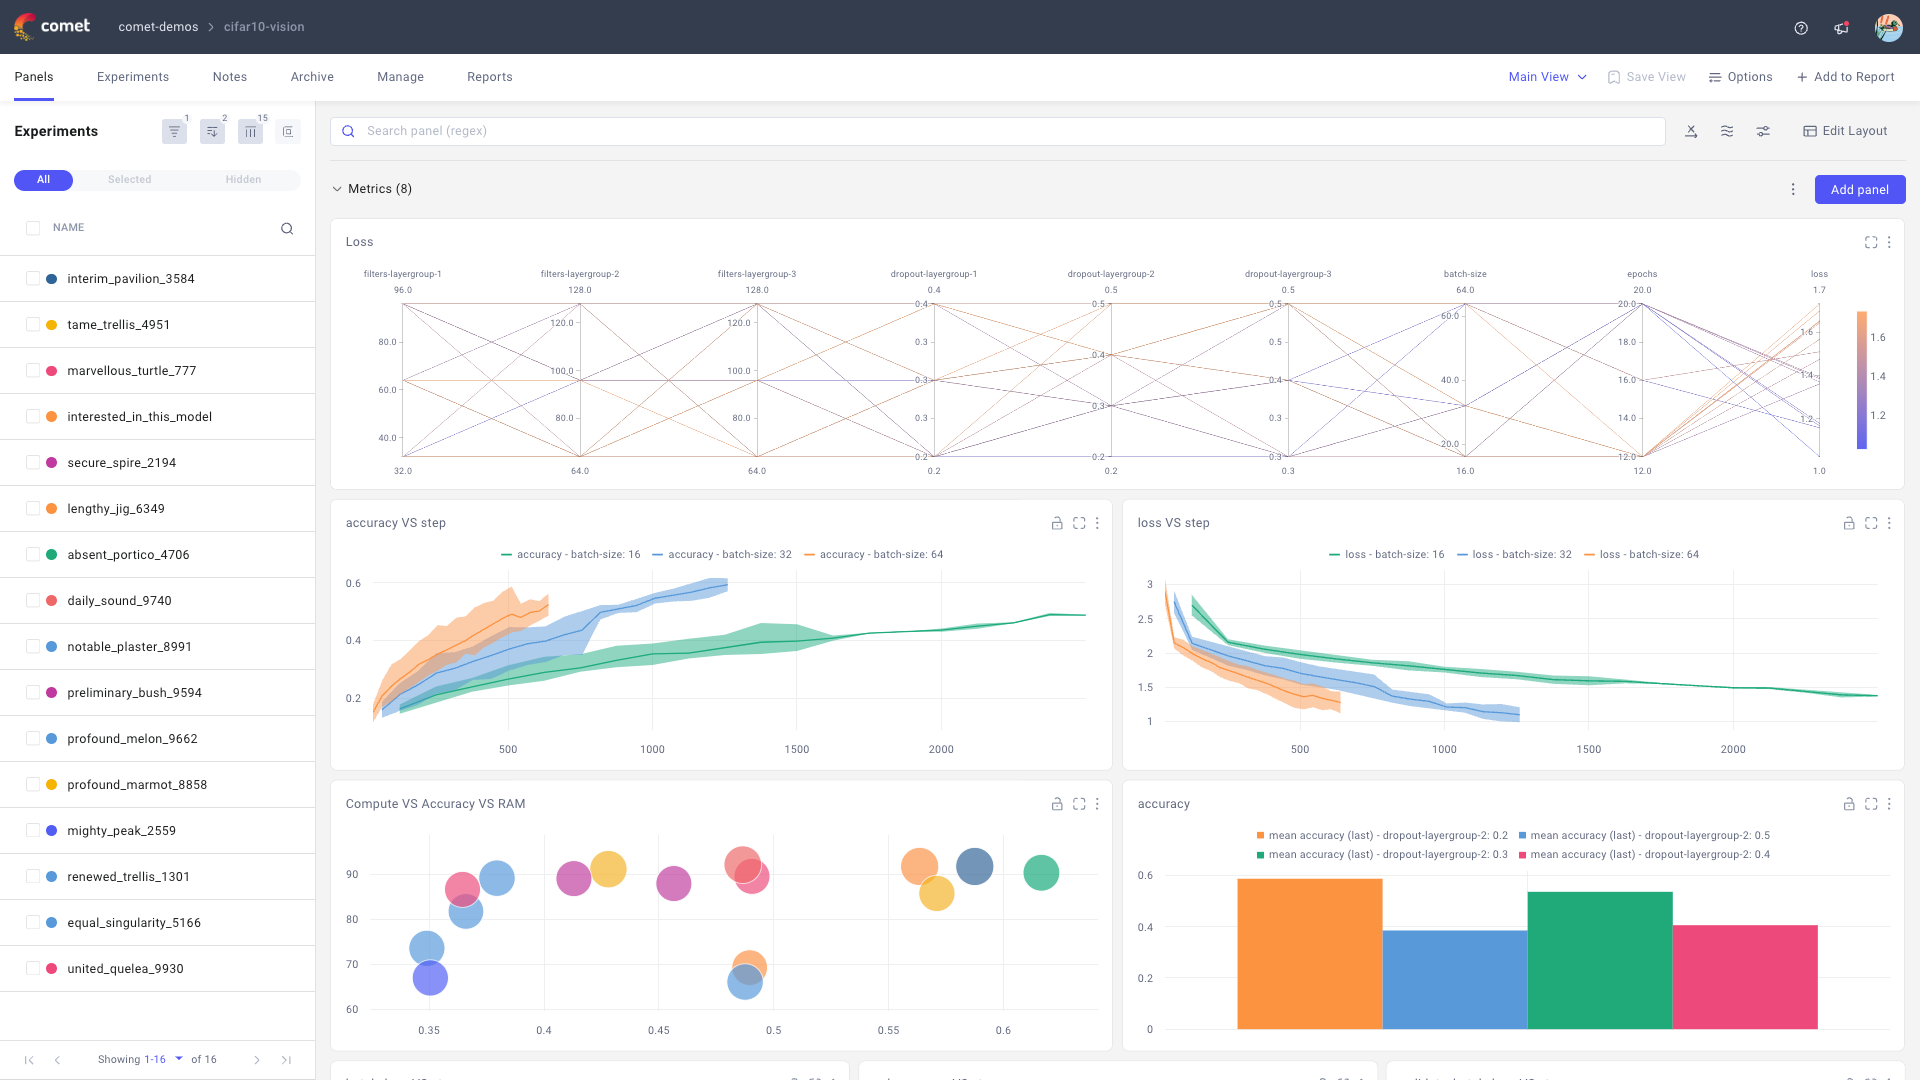
The project dashboard allows you to view and compare performance across multiple experiments. In addition to viewing the metrics we have added automatically for you, you can add more visualizations to the dashboard.
Each action is explored in detail in the respective sections below.
Note
When clicking on an experiment from the experiments list, you are redirected to the Single Experiment page.
Manage the experiments list
The Experiments sidebar provides you with a list of all your experiments. This list can be customized through some of the actions available next to the Experiments header:
- Filter experiments: Filter down the experiments based on any of the data logged to them.
- Sort experiments: Sort the experiments based on any of the data logged to them.
- Group experiments: Group experiments based on metadata, Comet will display in the charts the experiments from the last opened grouped.
Note
The experiments displayed in each panel is related to the experiments in the sidebar. You can view more experiments in each panel by increasing the page size to 100 for example. You can also go to the next page to see the next set of experiments.
Please refer to the Manage displayed experiments section for information on how to manage the experiments list.
Perform bulk actions on selected experiments
From the Project Panels page, you can select experiments and perform actions using the bottom action bar. The most commonly used actions include:
- Diff: Allows you to compare up to 4 experiments side by side
- Archive: Soft-delete the selected experiments
- Tag: Add a tag to all the selected experiments, can be useful for filtering
Please refer to the Perform bulk actions on selected experiments section for more information.
Update the dashboard view
The dashboard displays all panels for the specified view. Comet defaults to the "Auto Generated" view which is created by Comet automatically for your project and displays the 12 most common metrics for your project.
You can customize this dashboard by updating dashboard settings or adding your own visualizations to it. You can learn more about all the visualizations Comet has to offer here.
Note
Any changes you make to the Auto-Generated will be saved for your user but will not be accessible to other users. If you would like to share your view, simply you can save it using the Save View button.
Add, edit, and delete a panel
A panel is a built-in or custom Python visualization. Review the available panels in the Visualizations section.
To add a panel to your dashboard:
- Click Add Panel in the top right corner of the dashboard.
Select any of the built-in, community, or your personal collection of panels from the Panel Gallery popup.
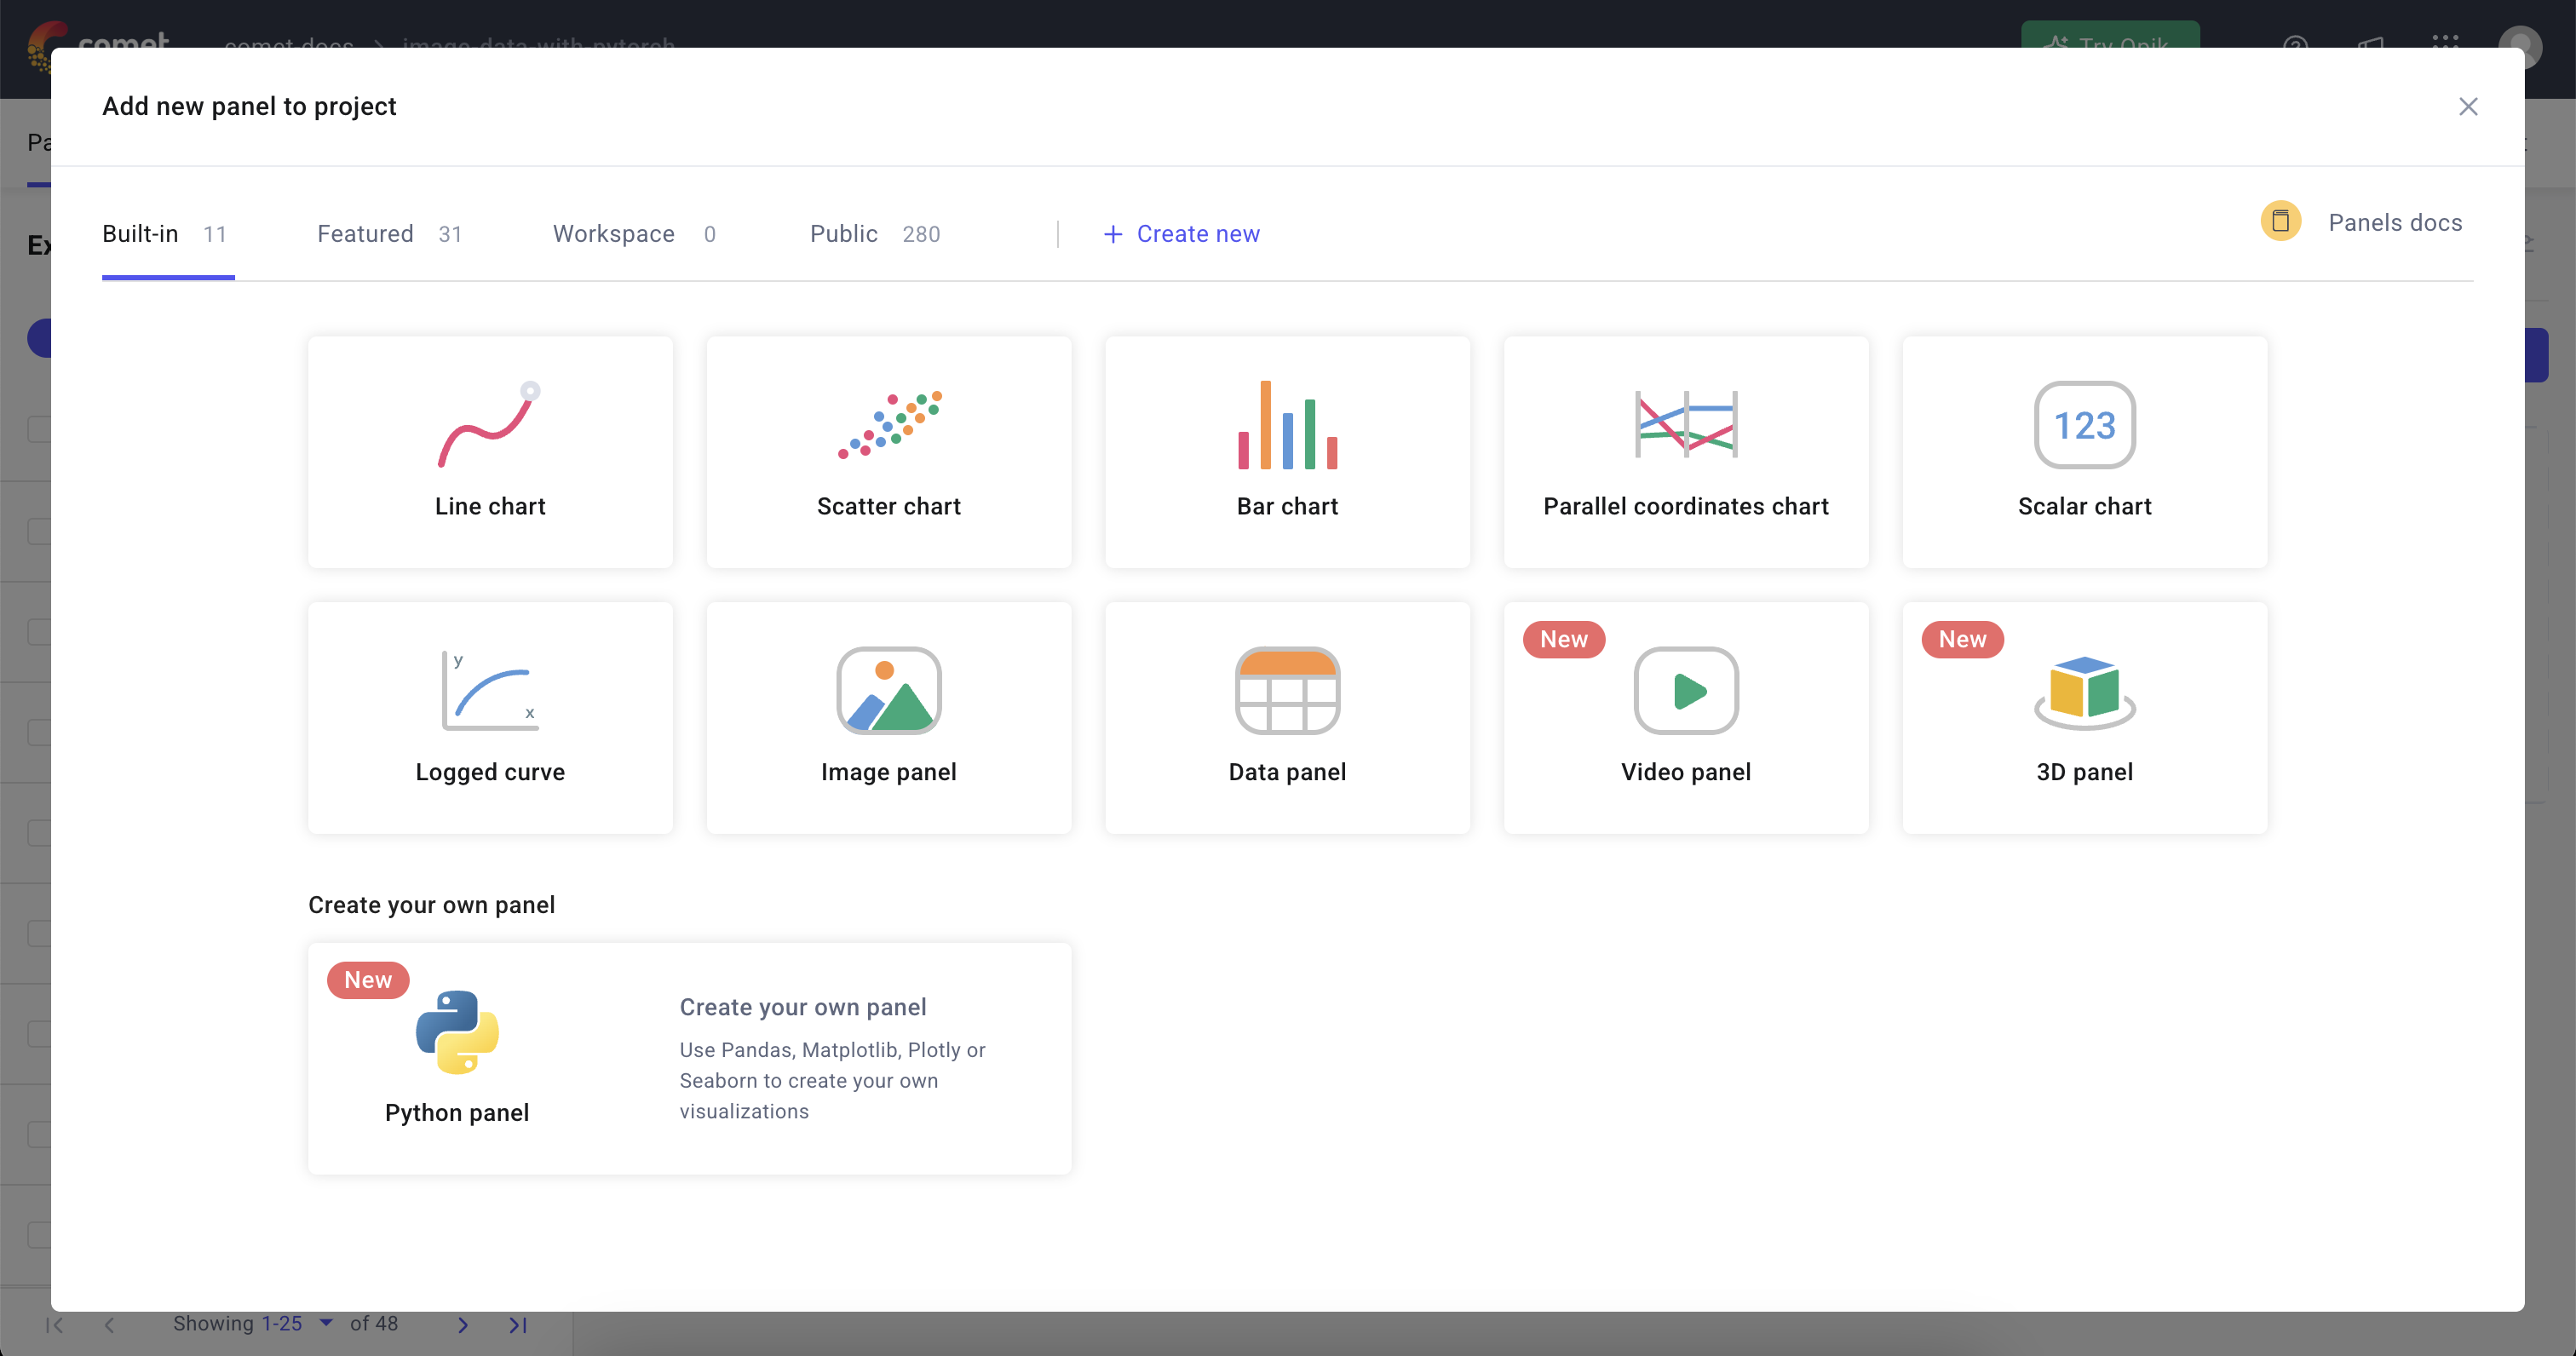
The Panels Gallery Configure the selected panel.
- Click Done when complete, or Reset to clear all settings.
Note
To edit or delete a panel you can use the panel menu by click on the three dots icon by the top right of the desired panel.
Dashboard settings
You can update dashboard settings by clicking on the relevant icon by the right of the Search panel (regex) bar.
All panels that are not locked will be updated following new dashboard settings, while locked panels follow their individual panel settings. You can toggle between the two settings by clicking on the lock icon in each panel.
Below we explore the actions you can perform to bulk update panel settings in the dashboard view.
Update the x-axis settings: You can update the x-axis for all unlocked panels, this can be useful to toggle between viewing metrics by
steporepoch.- Click on the first icon by the right of the Search panel (regex) bar.
- From the popup window, select the dimension to use for the x-axis.
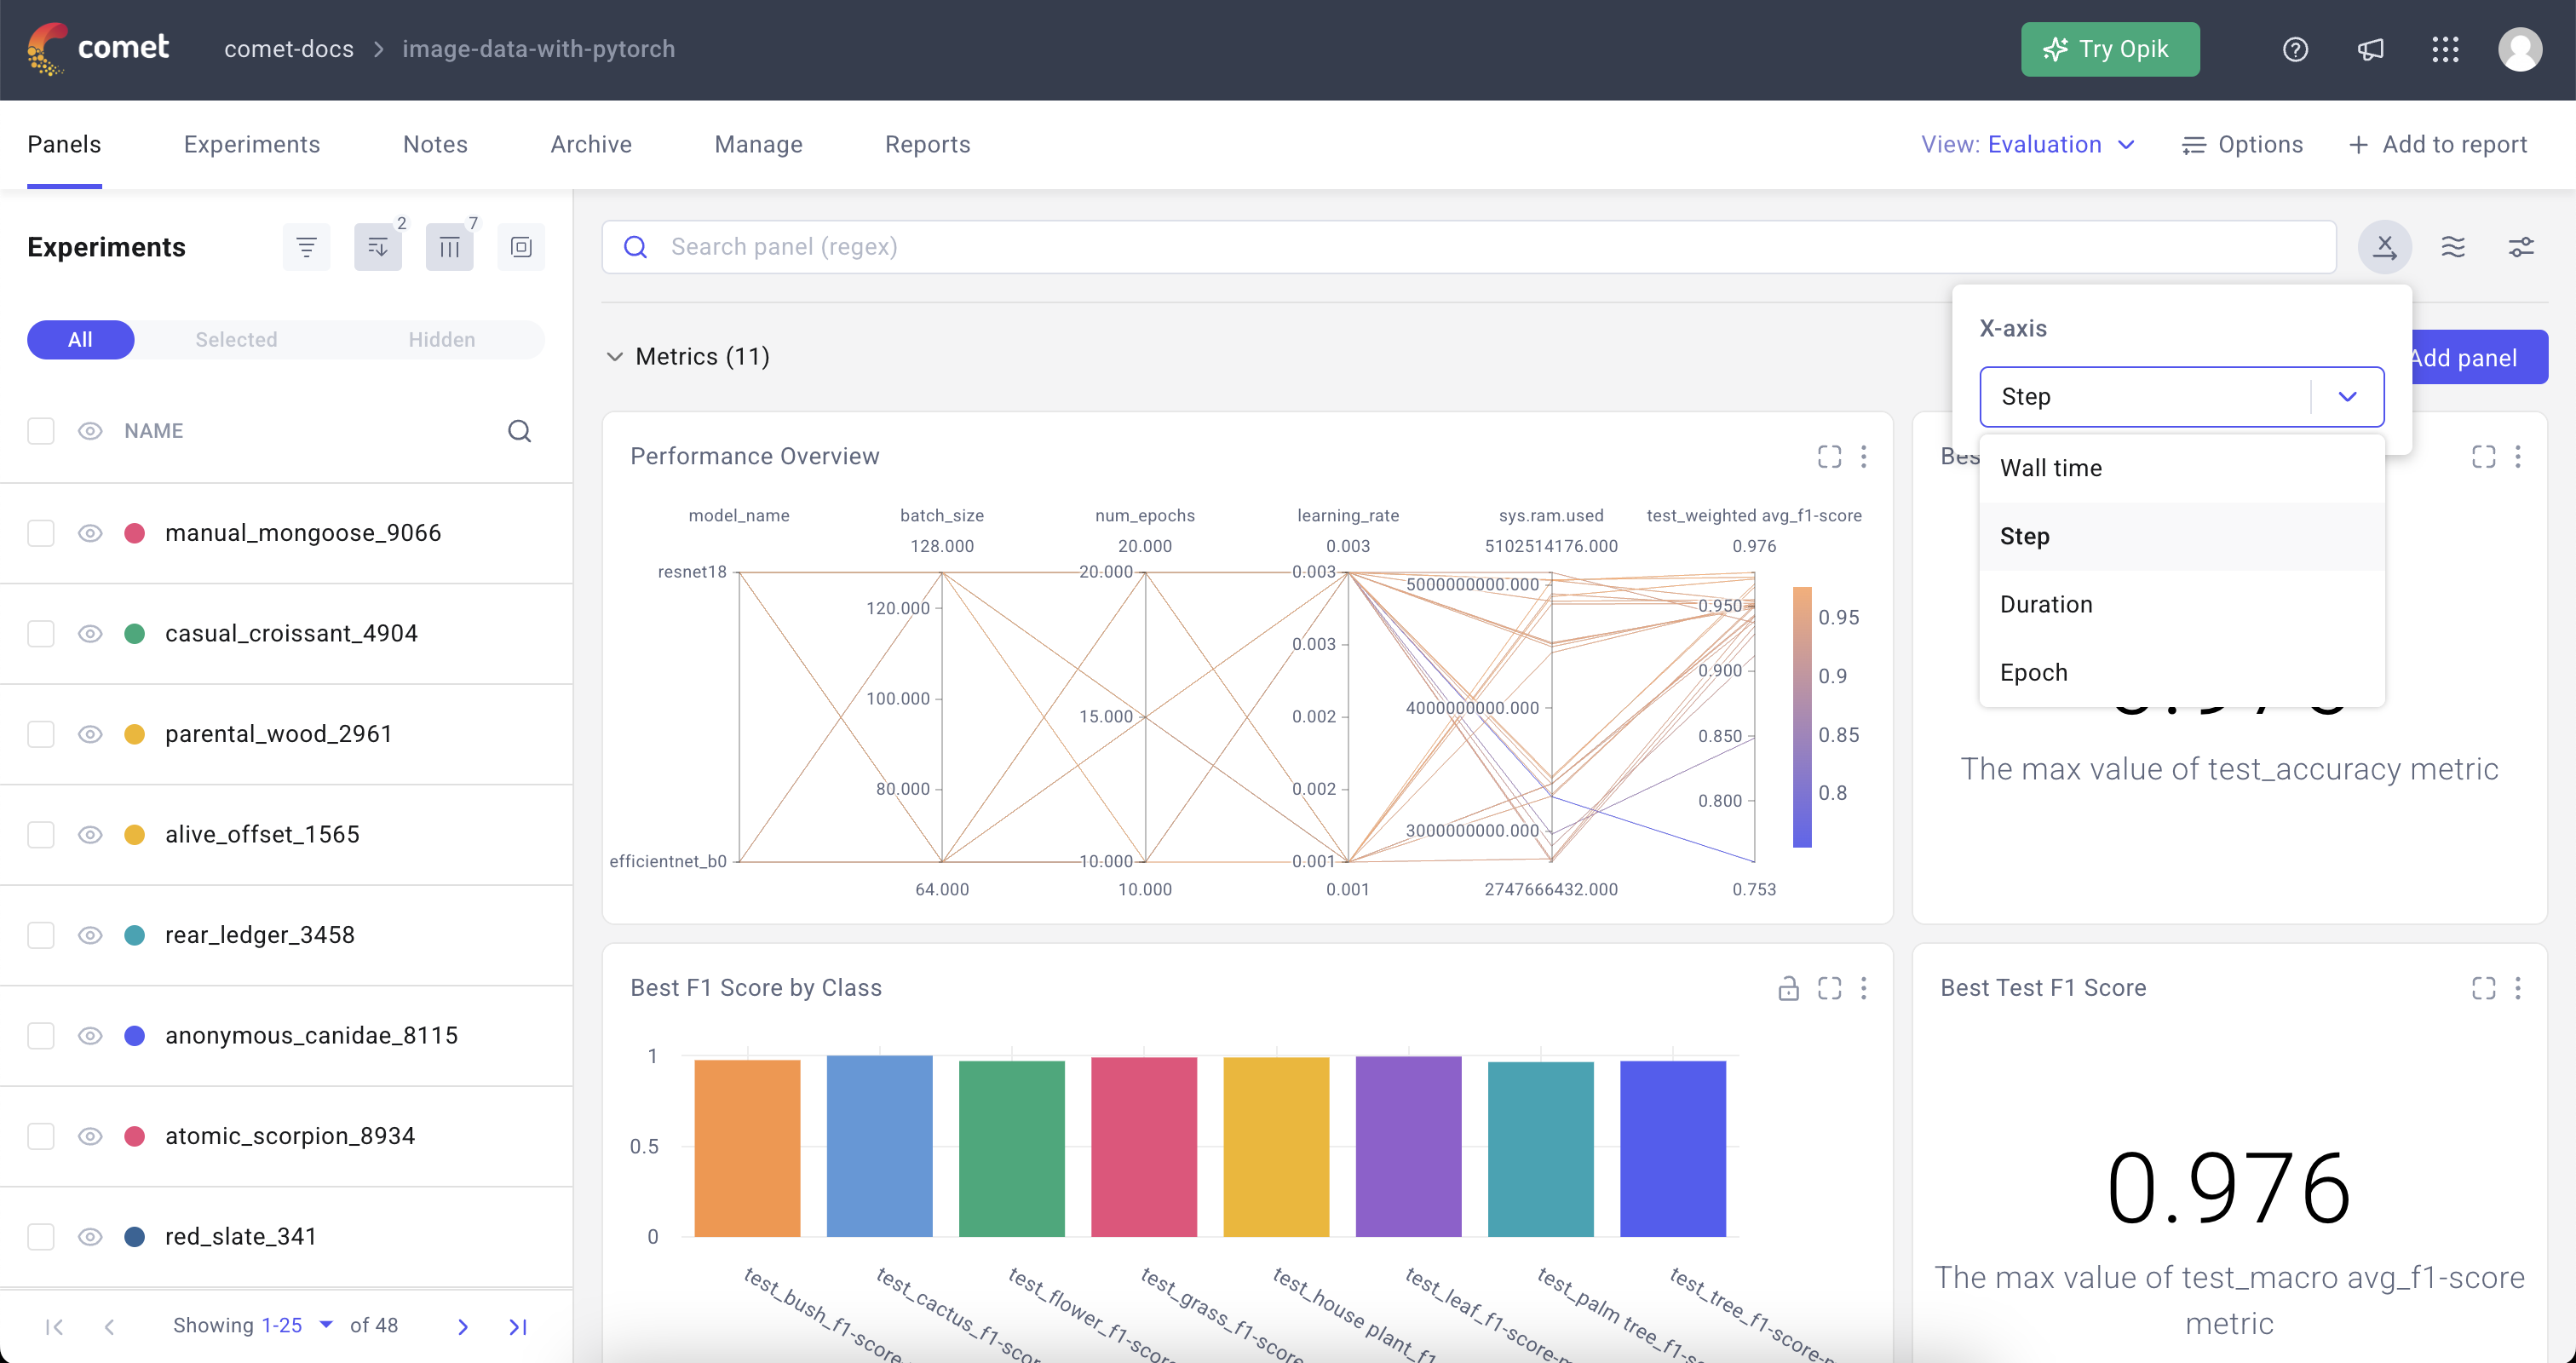
Select the dimension for the x axis of all unlocked panels in the dashboard Update the smoothing settings: You can add smoothing for all the unlocked panel which can be useful to focus on trends rather than small local fluctuations.
- Click on the second icon by the right of the Search panel (regex) bar.
- From the popup window, select the desired smoothing factor.
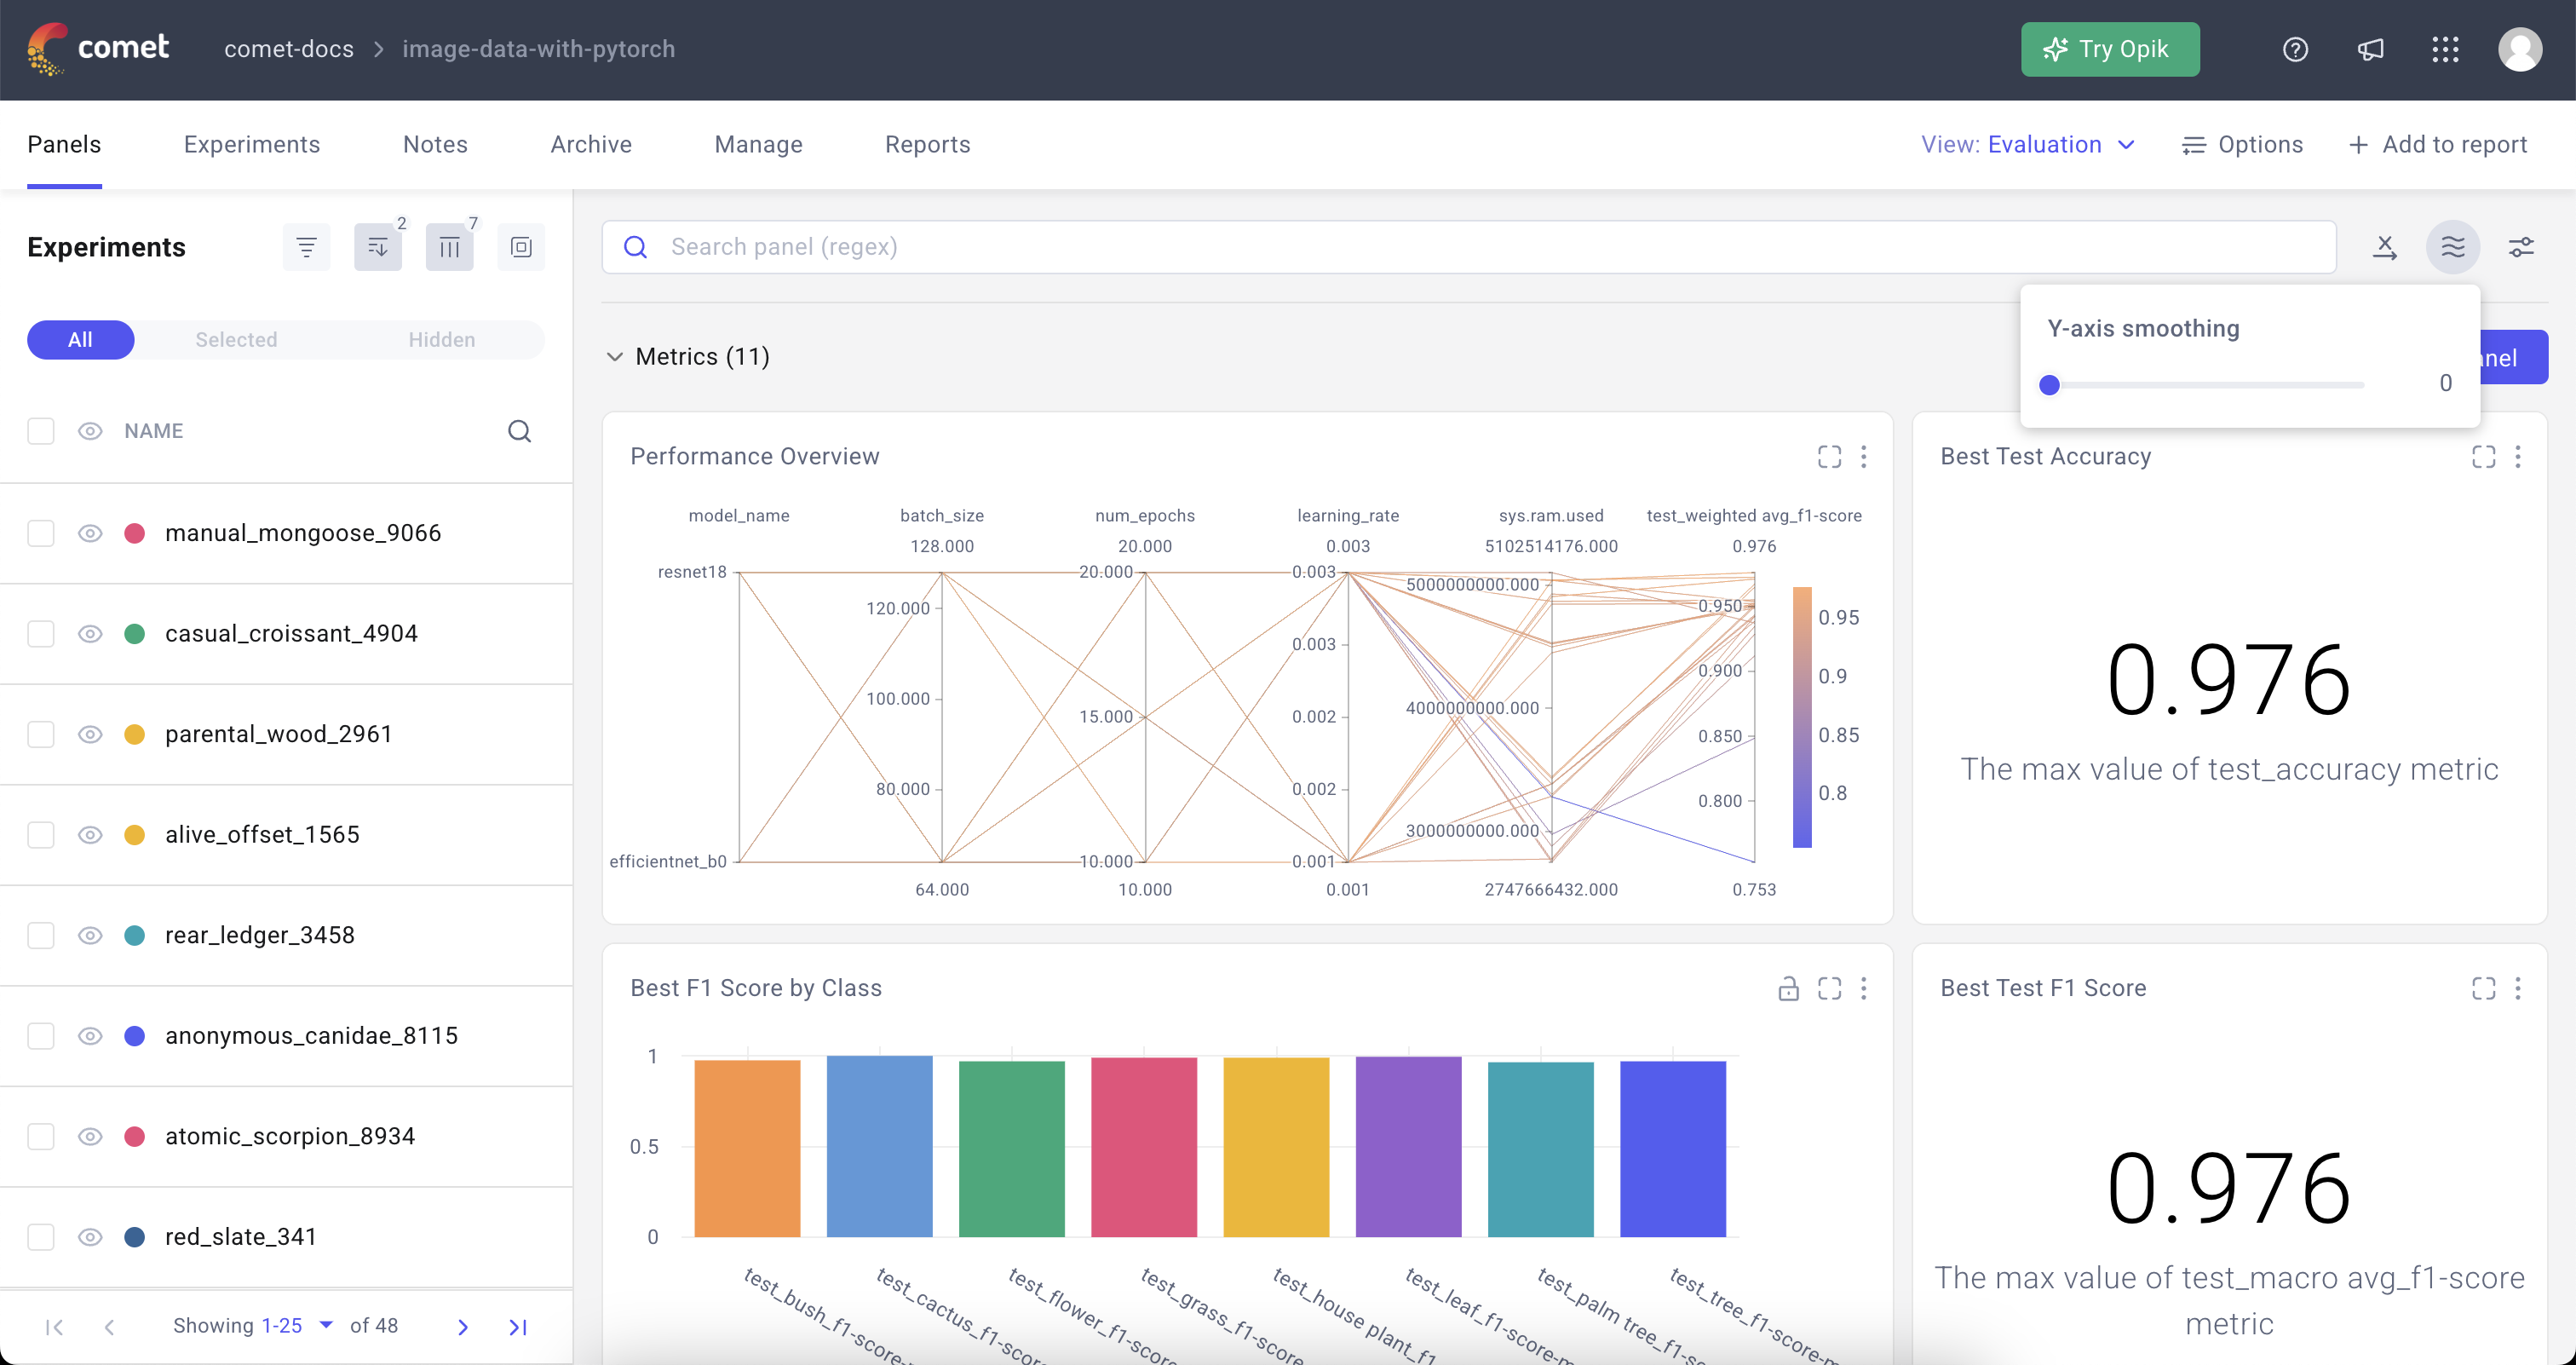
Select the smoothing factor for all unlocked panels in the dashboard Update the additional dashboard settings
Additional bulk actions for dashboard settings can be accessed by clicking on the third icon by the right of the Search panel (regex) bar. Choose to adjust one or more between:
- Sample size: 50, 100, 500, or 1000 [default is 100].
- Y-axis transformation: None, log_e, log_10, log scale [default is None].
- Outliers: whether to Show or Ignore [default is Show].
Edit dashboard layout
You can interactively change the layout of the dashboard:
- Click on Edit layout by the top right corner of the dashboard view.
- Update the panel layout by either or both:
- Drag and drop the panel in the desired location.
- Change the panel's dimension by adjusting it from the bottom right corner.
Manage dashboard
The dashboard menu bar by the left of the pages tabs gives you access to high-level management functionalities for the dashboard.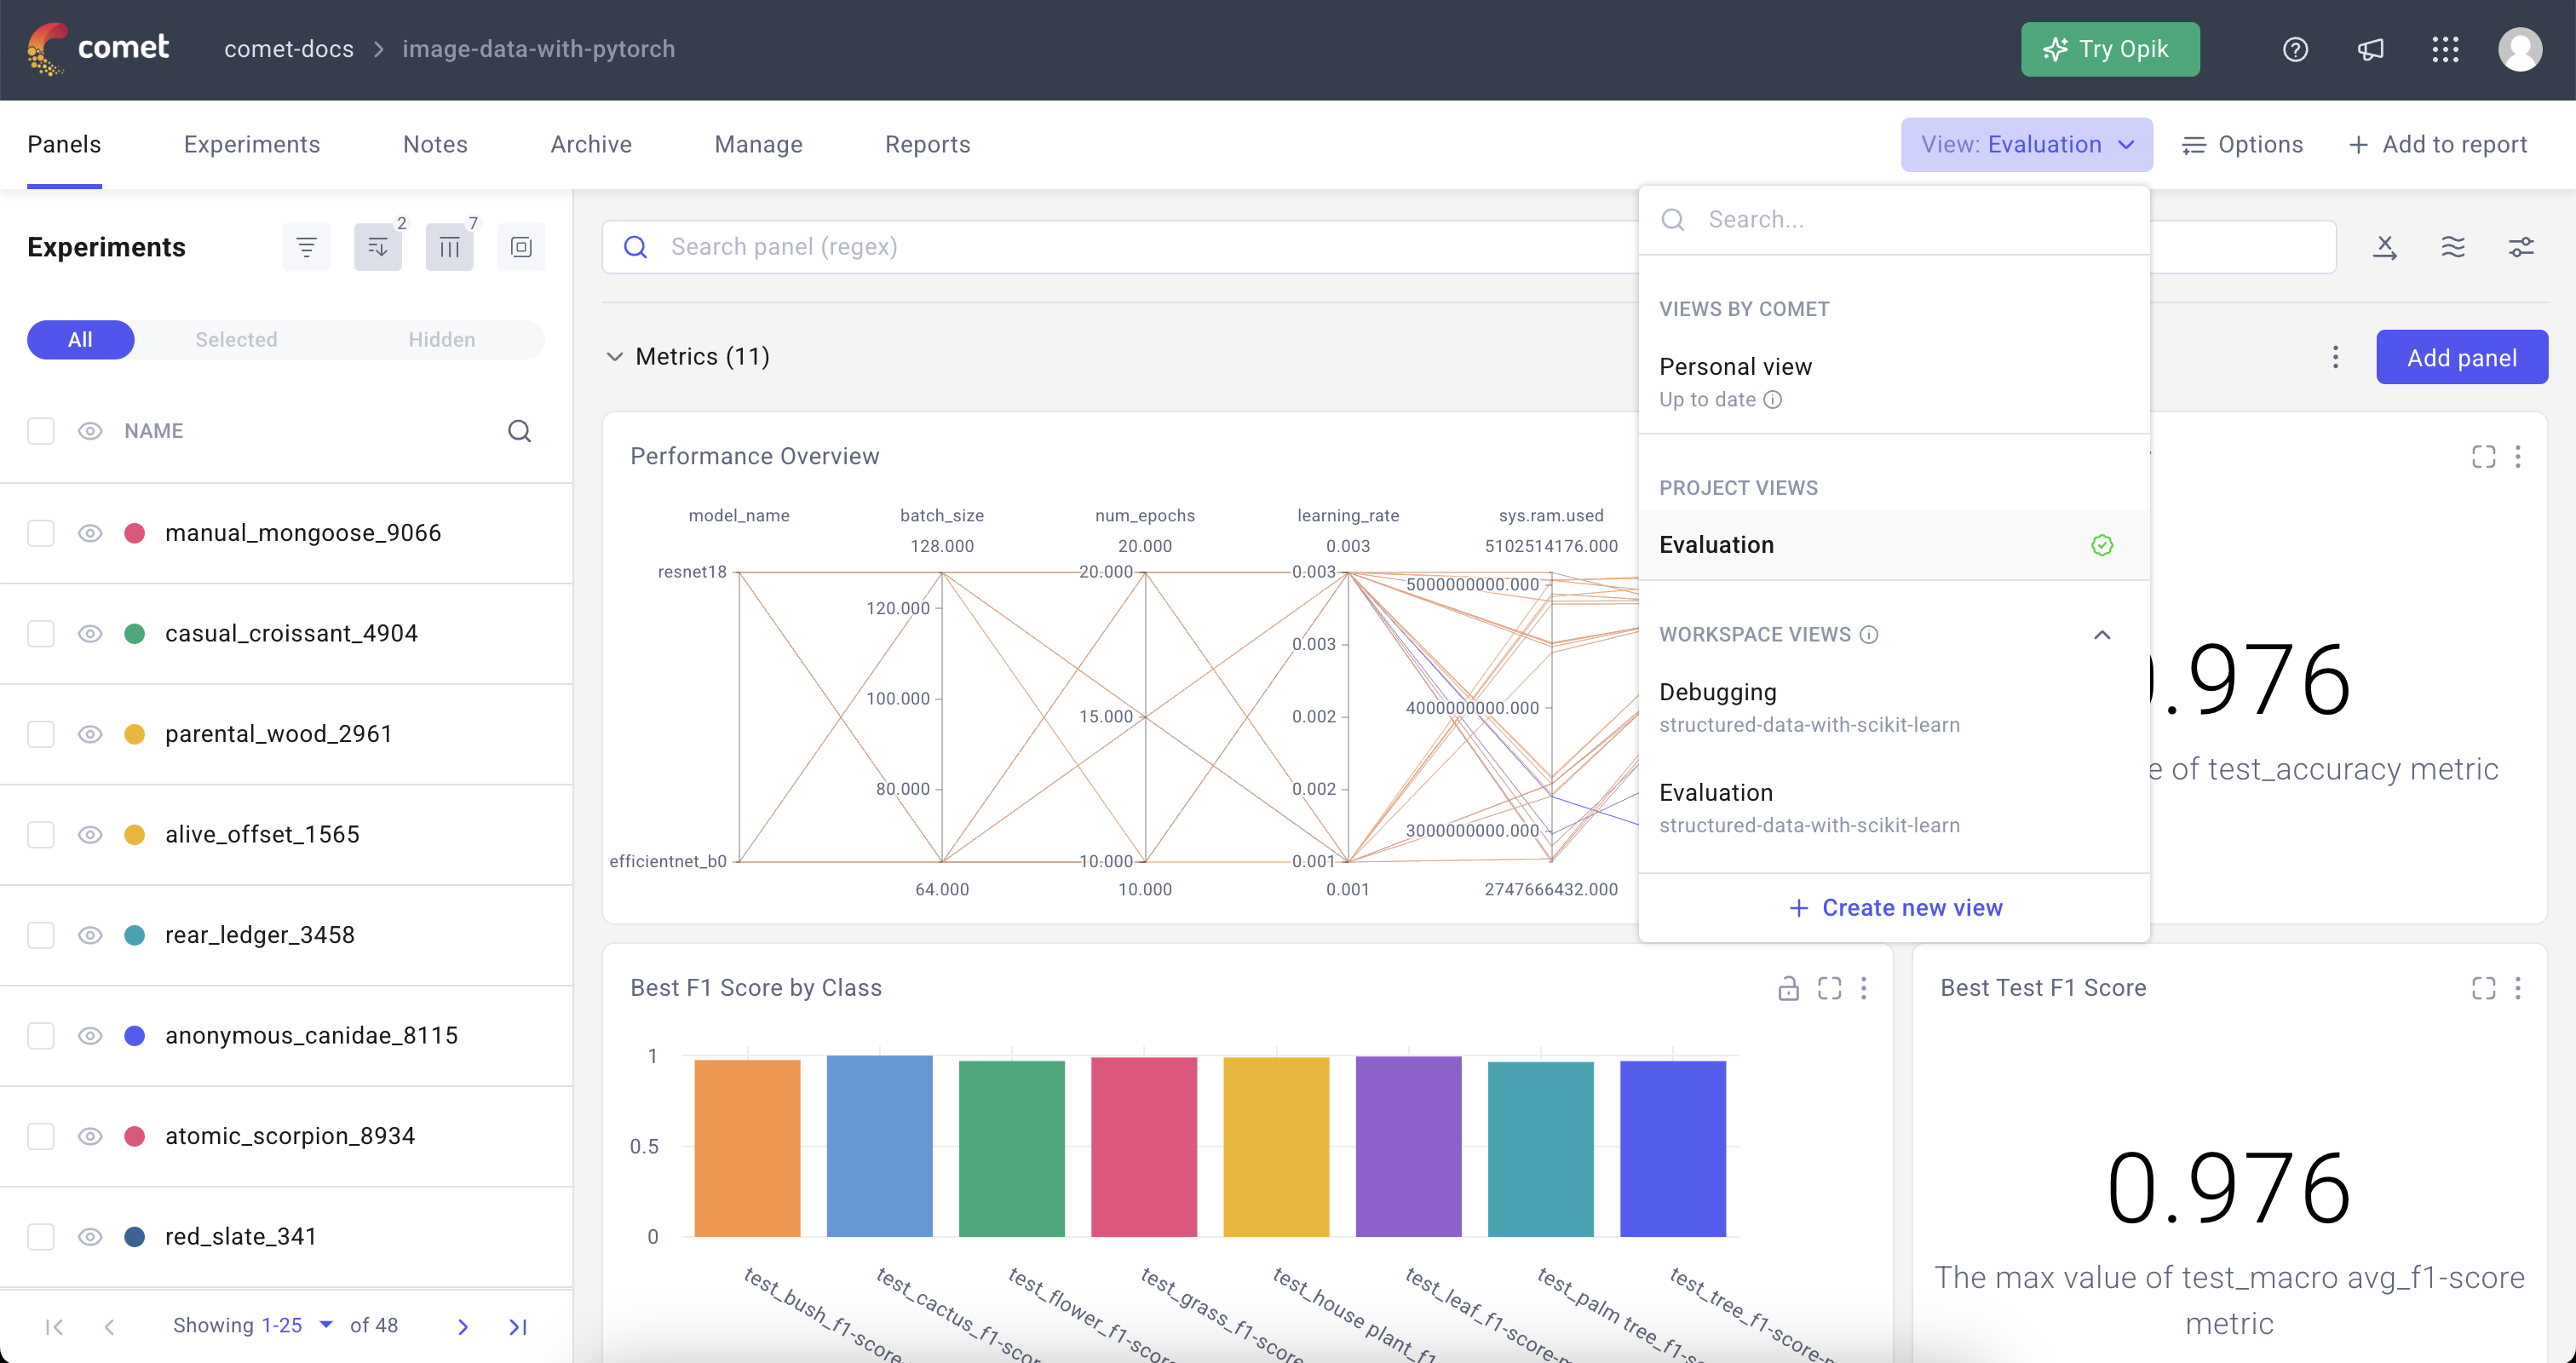
Each action is explored in detail in the respective sections below.
Save, edit, delete, and update dashboard views
By default, the Panels page opens the "Auto Generated" dashboard view, created by Comet. You can navigate to another view by:
- Click on the Dashboard view dropdown (set to "Auto Generated" by default).
- Select the desired custom view from the dropdown.
Note
Dashboard views can be shared between projects allowing you to share your dashboards across many projects.
To save a view:
- Click Save View.
- Save the view in the current view, or in a new view by selecting Save as a new view and giving it a name.
Select Set as default view to make this the default. Click Save.
A notification confirming the save is displayed in the window banner and the view name is displayed in the Project menu bar. The view name is research in this example:
To abandon the changes you have made, click the view name, then click Discard.
Warning
Selected areas in Panels are not saved.
If you make changes to this view and you wish to keep them:
- Click Save View.
- Select Save changes to the view.
- Click Save.
You can also select a specific view to be the default view by clicking on the check icon. This will mark it as the default view and will be the one loaded by default whenever a user navigates to the project.
Perform more operations on the dashboard
The Options button in the dashboard menu bar allows you to:
- Share the dashboard view via URL (only for Public projects).
- Update the decimal precision [default is 3].
- Define whether to Auto Refresh the data, or decide to Refresh now.
You can add a view to a report by clicking Add to Report button on the top right corner of the dashboard menu bar.