The Prompts page
Comet LLM Projects have been designed to support you in performing smart analysis of your logged prompt engineering workflows.
This guide introduces you to the Comet UI elements and the corresponding actions that you can take when exploring your LLM projects from the Prompts page.
The Prompts table
The Prompts table is a view of all logged prompts and chains listed as rows with relevant metadata details expanded as columns.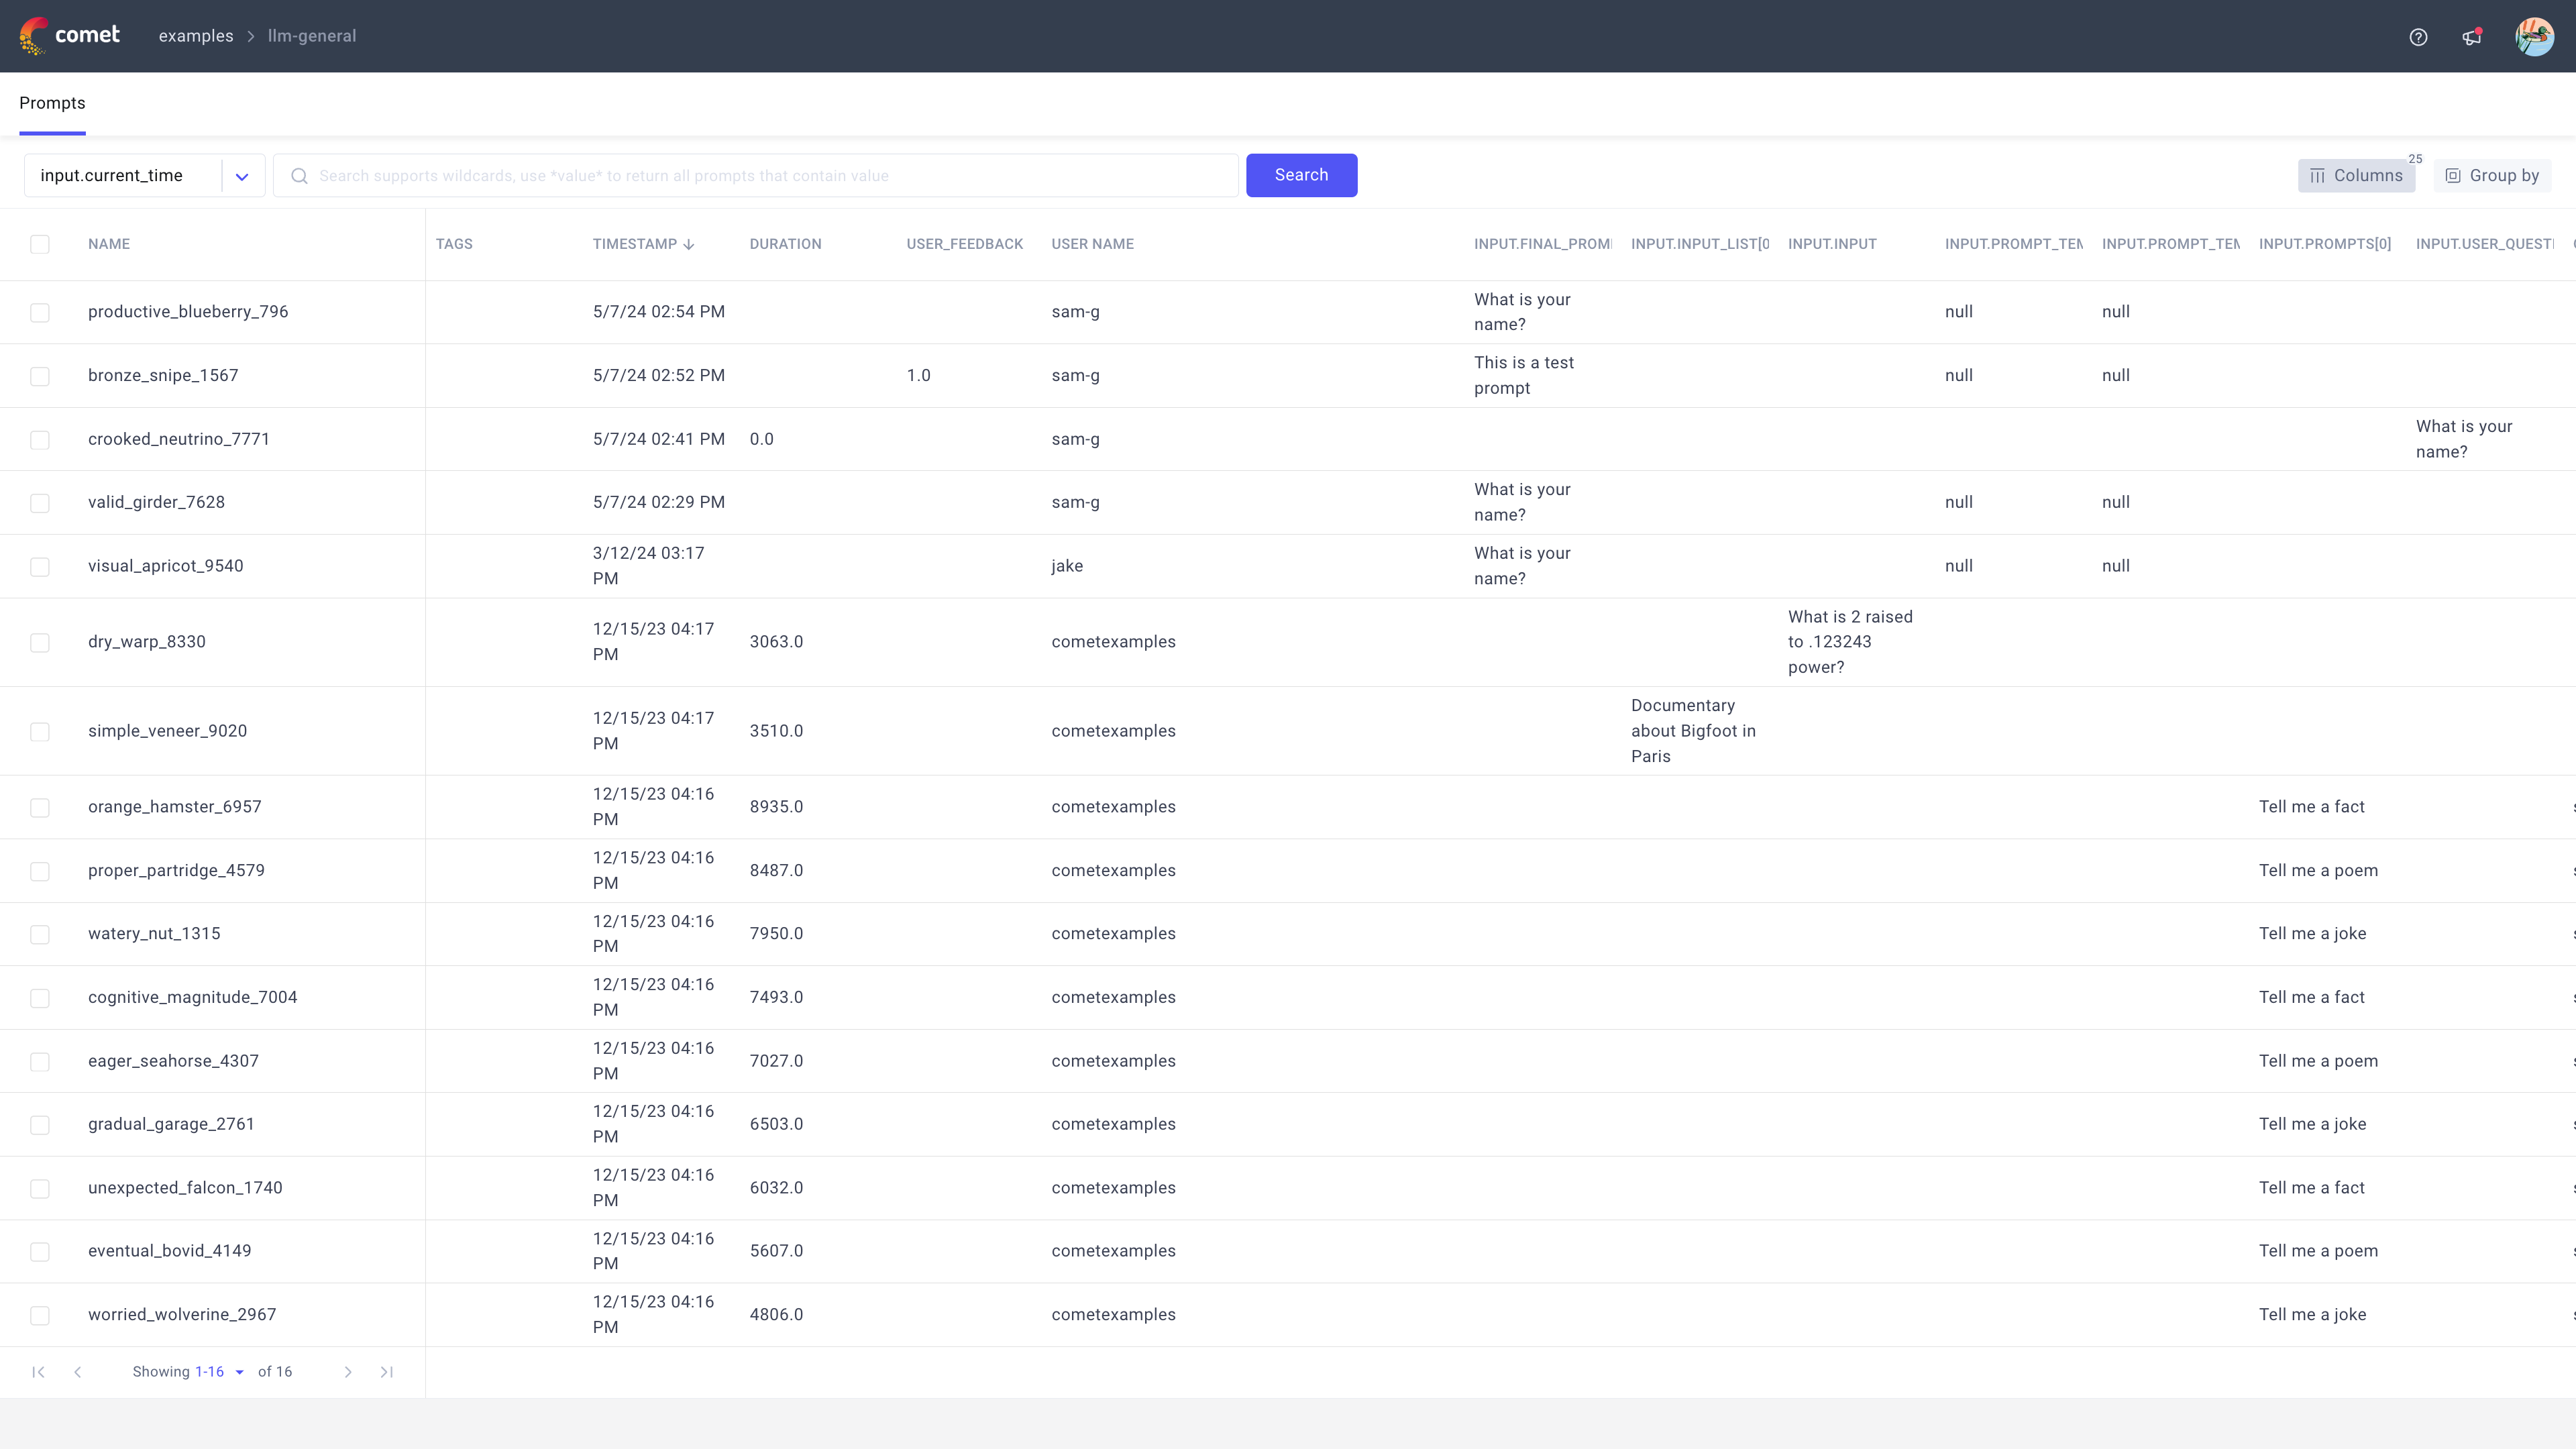
Each column header corresponds to a metadata attribute logged in the LLM Project, so the exact list of the displayed default headers can vary across projects.
The UI actions that you can take from the Prompts table include:
Customize the table view to fully tailor the prompt engineering analysis to your requirements.
Perform bulk actions on prompts and chains to manage your prompt engineering workflows.
Customize the table view
You can customize the Prompts table view through the actions available in the top horizontal action bar displayed at the top.
Specifically, you can Search across prompts and chains, edit the table Columns, and apply a Group by for prompts and chains. Find more details about each action below.
Search across prompts and chains
To perform a search in the Prompts table, first select the column you want to search on from the dropdown list and then enter your search query.
The Prompts table is updated to only display matching prompts and/or chains with the search query highlighted in the selected column field.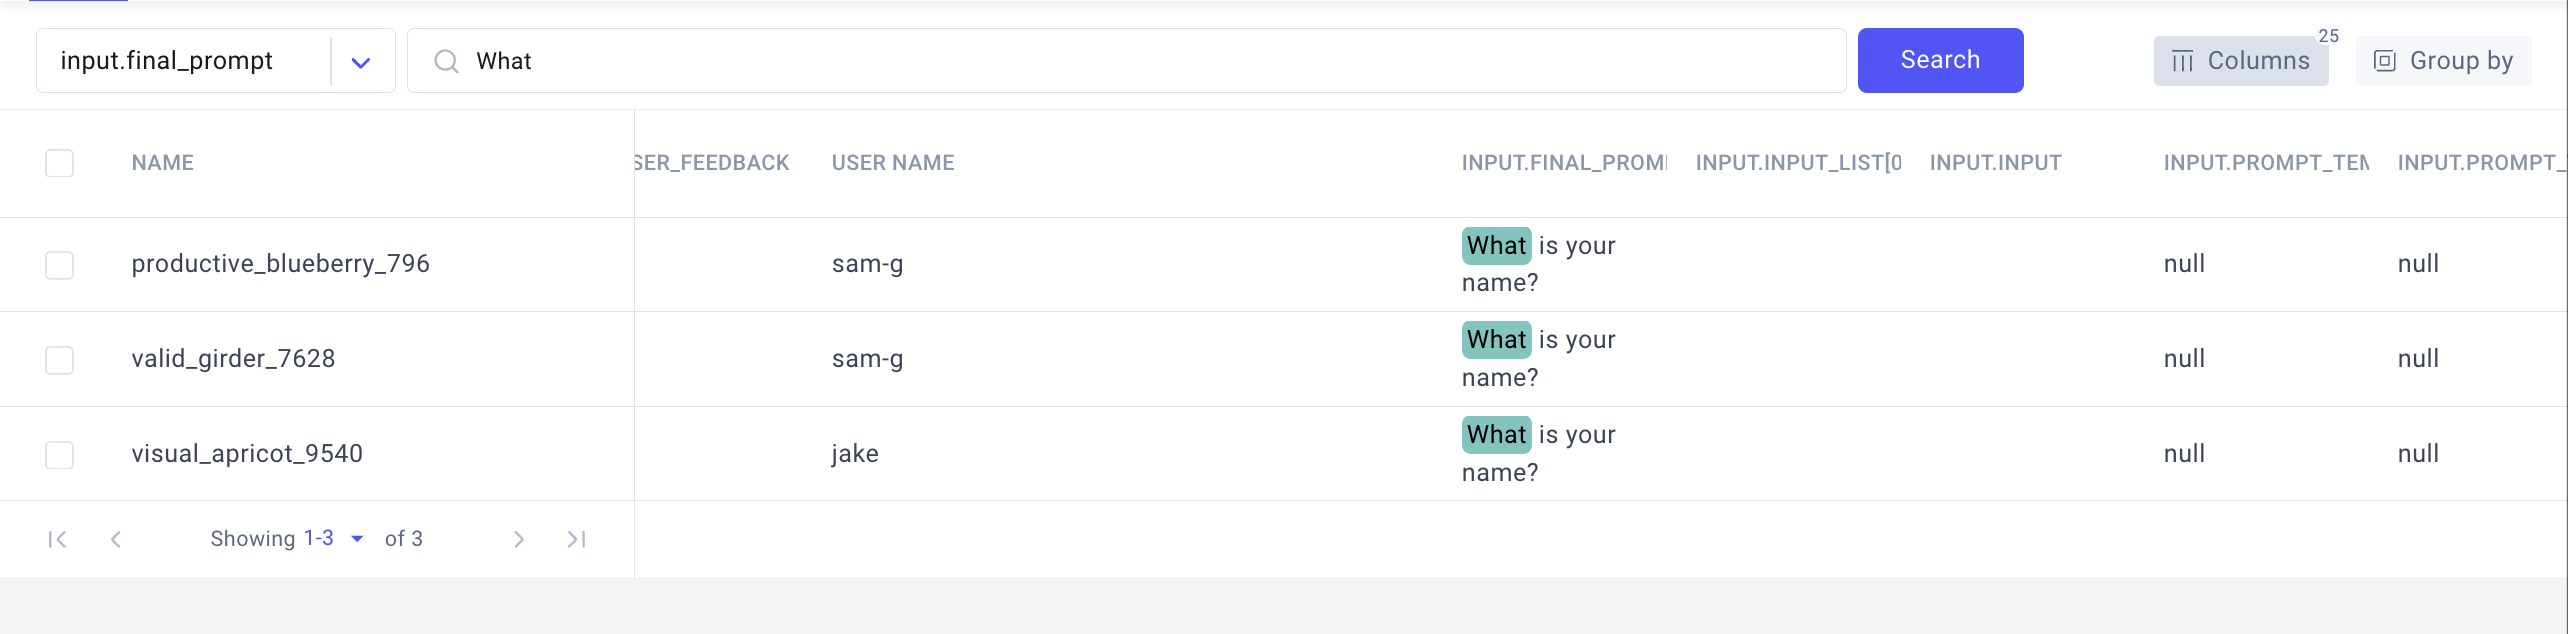
The Prompts table supports three search methods:
- Approximate search: By typing your query directly. This is the default approach.
- Exact search: By wrapping your query with
". - Wildcard search: By using the wildcard
*to match search patterns.
Edit the columns
You can edit the columns displayed in the table view by clicking on the Columns button.
The interactive column customization window allows you to:
- Add a column by typing the name or selecting the name from dropdown.
- Remove a column by clicking on the ⊗ icon by the column name tag.
- Change the order of the columns by drag-and-drop.
Group prompts and chains by columns
You can organize prompts based on any of the metadata columns of the Prompts table by clicking on the Group by button.
Just like for the Columns button, you can add, remove, and drag-and-drop your chosen column names to create the group by.
For example, if you logged a unique identifier for each prompt template you are using, you could group by this identifier to better analyze the performance of each template.
Note
For each group, the Prompts table automatically calculates and displays the average values for the Duration column and the User Feedback column.
Use this information to easily compare the functional and non-functional performance of your prompt engineering across multiple groups.
Perform bulk actions on prompts and chains
From the Prompts table view, you can perform bulk actions on prompts and chains by activating the check box for the chosen table rows.
When one or more table rows are selected, a blue horizontal action bar appears at the bottom of the screen that allows you to perform bulk actions including:
- Delete: Hard-delete the selected prompts and/or chains.
The Prompt sidebar
When you click on a Prompts table entry, the Prompt sidebar opens to display all the information logged for that prompt or chain (including metadata, response, prompt template and variables, etc.) in the Prompt run analysis module.
If the selected entry is a chain, the Chain trace module also displays to give you a more fine-grained control over the analysis of each chain step.
Tip
While the Prompt sidebar is open, you can quickly navigate between prompts by either clicking on a different row in the sidebar or by clicking on previous / next.
The Prompt run analysis module
The Prompt run analysis module of the Prompt sidebar displays all the information saved when logging the prompt or chain.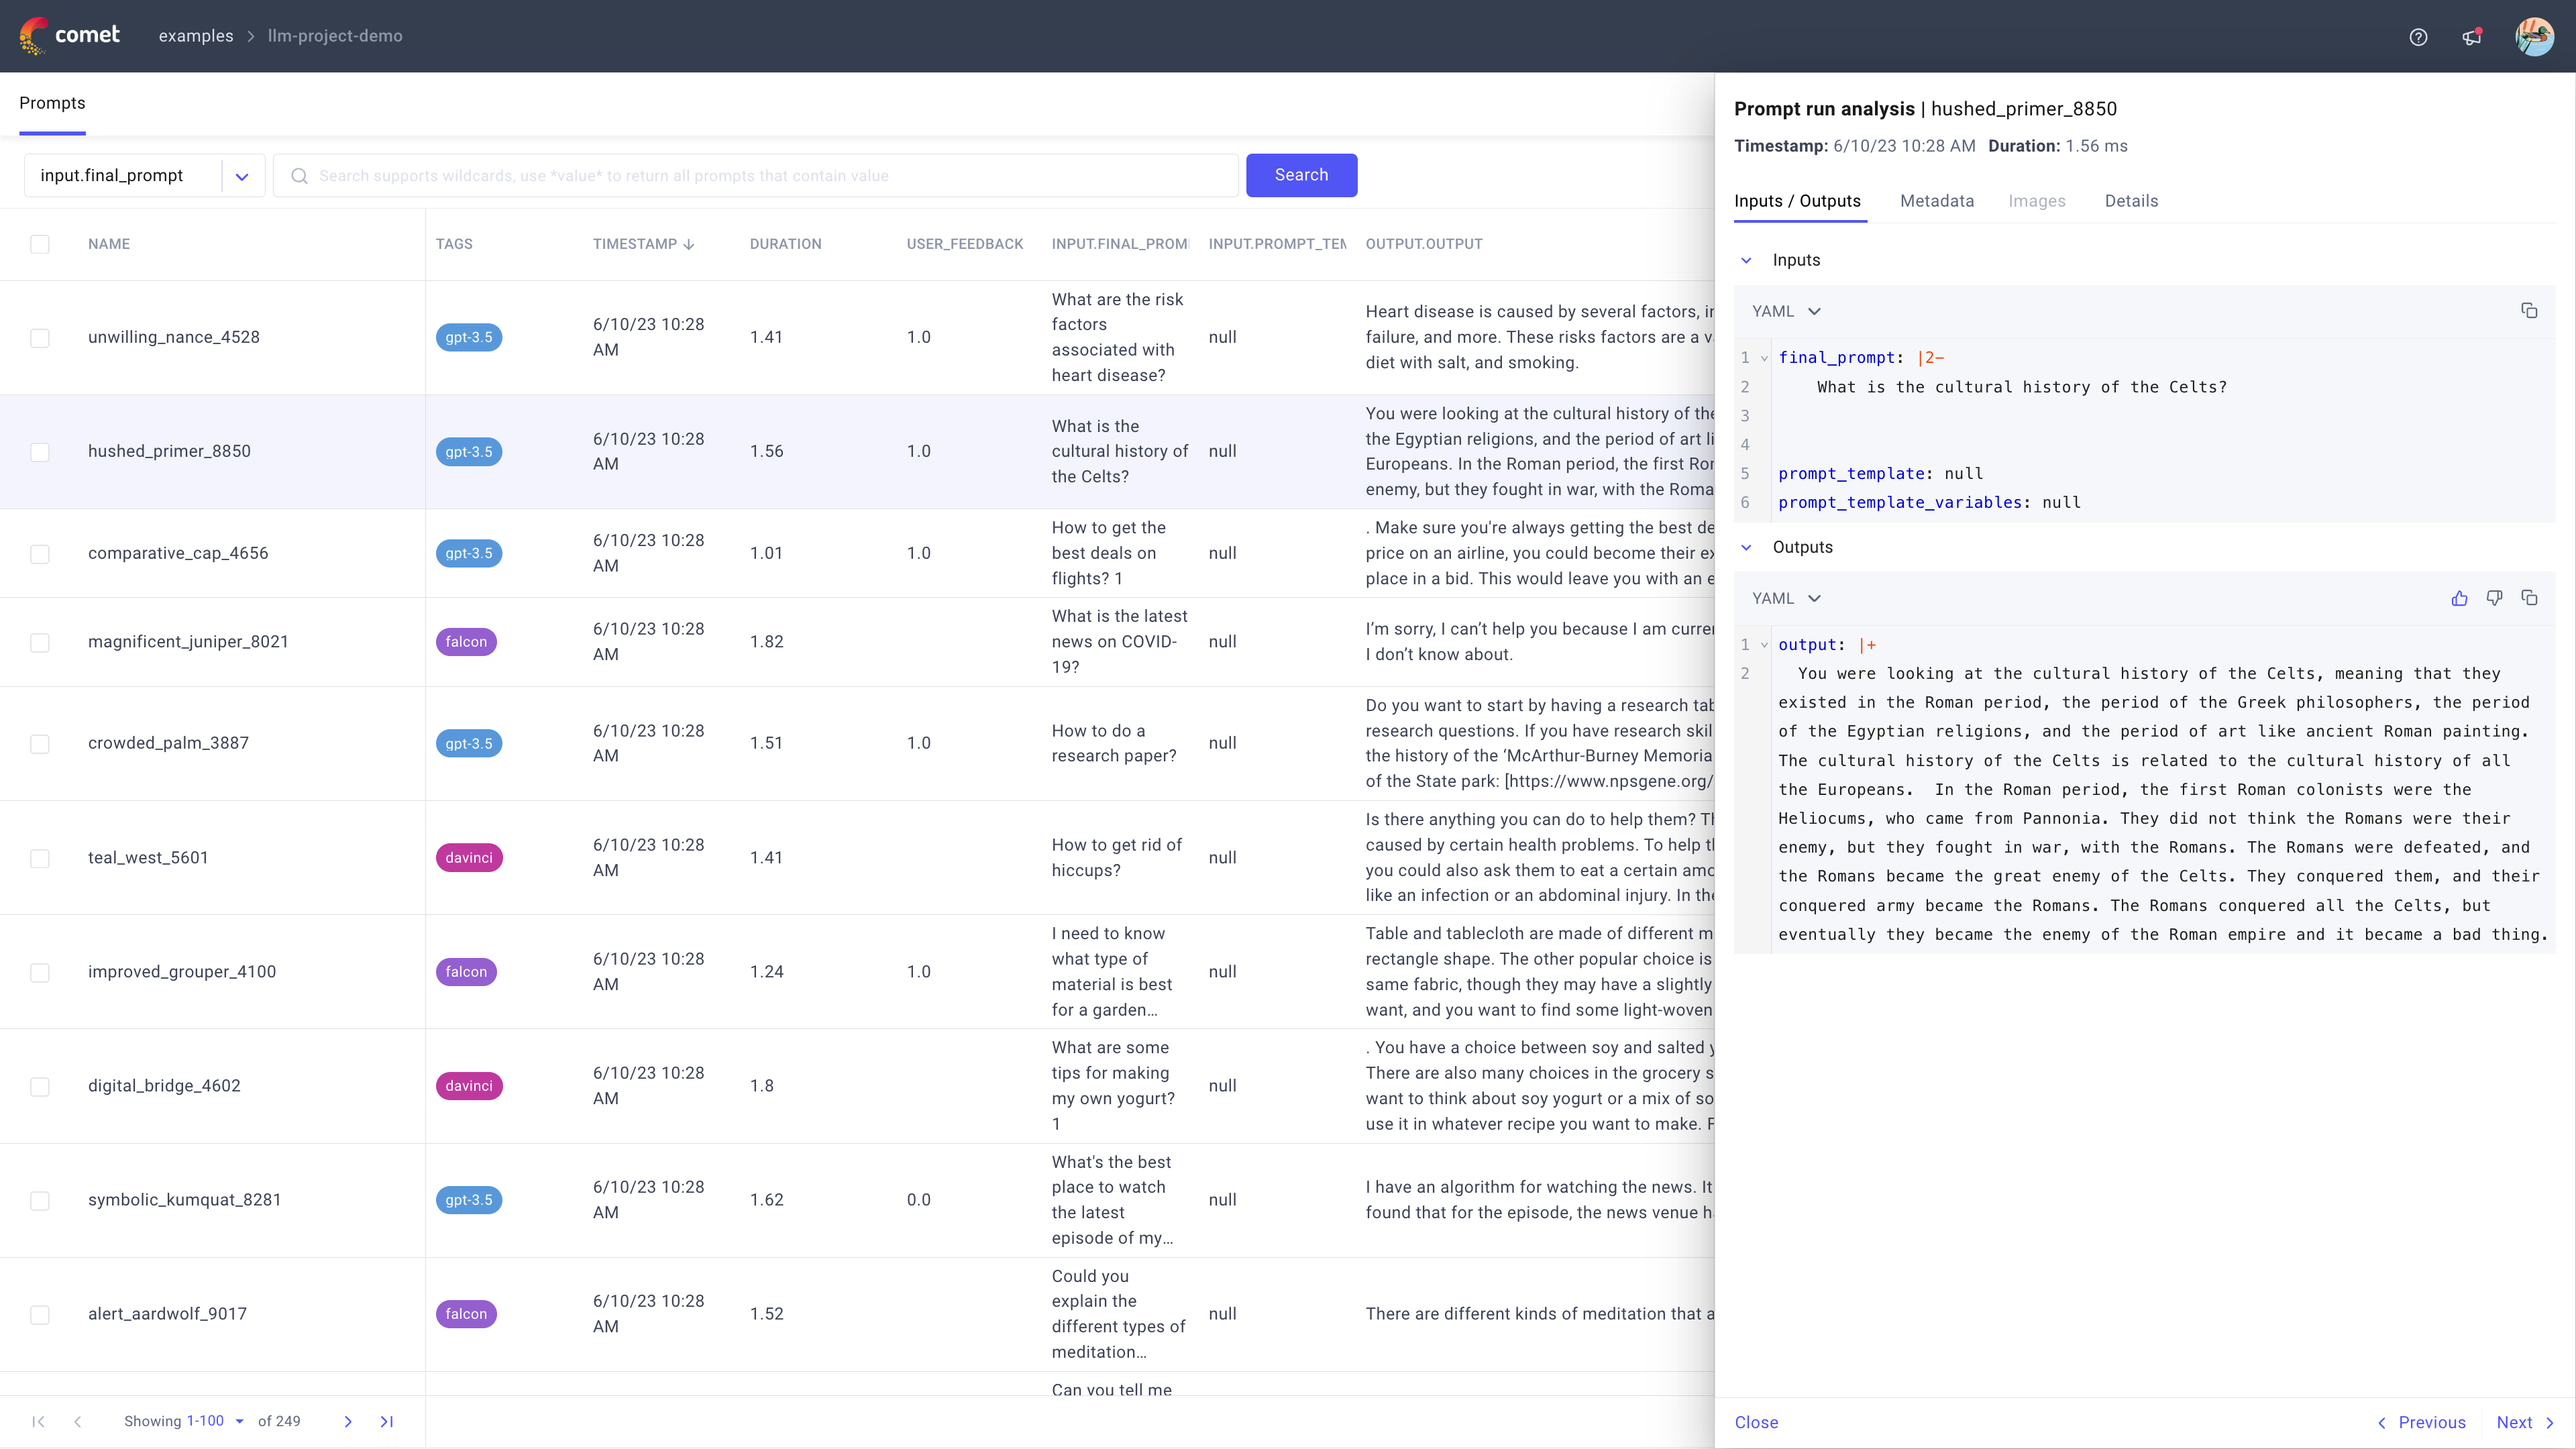
The sidebar has the following sections:
Inputs / Outputs: Displays all the inputs and outputs logged to the prompt, chain or chain span, in the JSON or YAML format.
You can:
- Swap between JSON and YAML format by clicking on the Expand More icon by the side of the JSON (or YAML) label in the top left corner.
- Expand and collapse long YAML / JSON sections by clicking on the Expand More icon in the code editor to the left of the relevant row number.
- Add or update the feedback score for the selected prompt or chain using the thumb up / thumb down icons in the Outputs section.
Metadata: Displays all the logged metadata fields.
Useful metadata to log includes the model used, number of tokens, and any other information relevant to the LLM call.
Images: Displays all images used for the input prompt, chain or chain span.
Details: Displays information automatically logged by CometLLM including name, category, timestamp, duration, and user name, for the logged entry.
Warning
Currently, the Images section is only populated for prompt engineering workflows logged via the OpenAI integration.
The Chain trace module
If the selected Prompts table entry is a chain, the Chain trace module of the Prompt sidebar automatically displays by the left side of the Prompt run analysis module.
This chain viewer allows you to quickly answer:
- How long did the chain take to execute?
- What are the individual steps composing the chain?
- What are the inputs and outputs of each chain step?
When selecting a specific chain step, the Prompt run analysis module to the right automatically updates to display the information for that particular span allowing you to analyze with precision what happened throughout the execution of the chain.