Analyze hyperparameter tuning results
Comet Optimizer automatically organizes your tuning trials inside Experiment runs. You can analyze hyperparameter tuning results with the Comet UI as you would with any standard Comet experiment run.
Below, we highlight some Comet Experiment UI functionalities which are particularly useful when analyzing optimization results.
Analyze tuning results in the Project Panels Page
The Project Panels page is a collection of all the experiments run within the same Comet project and workspace. All tuning runs for an optimization job belong to the same project by default.
When analyzing tuning results, you will likely:
- Use Diff to compare experiments side by side with respect to hyperparameter selection and metrics performance.
- Add the Parallel Coordinates Chart and/or the Optimizer Report to a new dashboard view, as described below.
Add a Parallel Coordinates Chart
The Parallel Coordinates Chart allows you to visualize all the hyperparameter selections with resulting optimization performance.
To set it up optimally for Comet Optimizer reporting, you can simply:
- Click on the Add panel button.
- Choose Parallel Coordinates Chart from the Built-in tab.
- Configure the chart by:
- Selecting the optimization metric as Target variable
- Adding all optimization parameters as Y-axis entries.
- Save the chart by clicking on Done in the bottom-right corner.
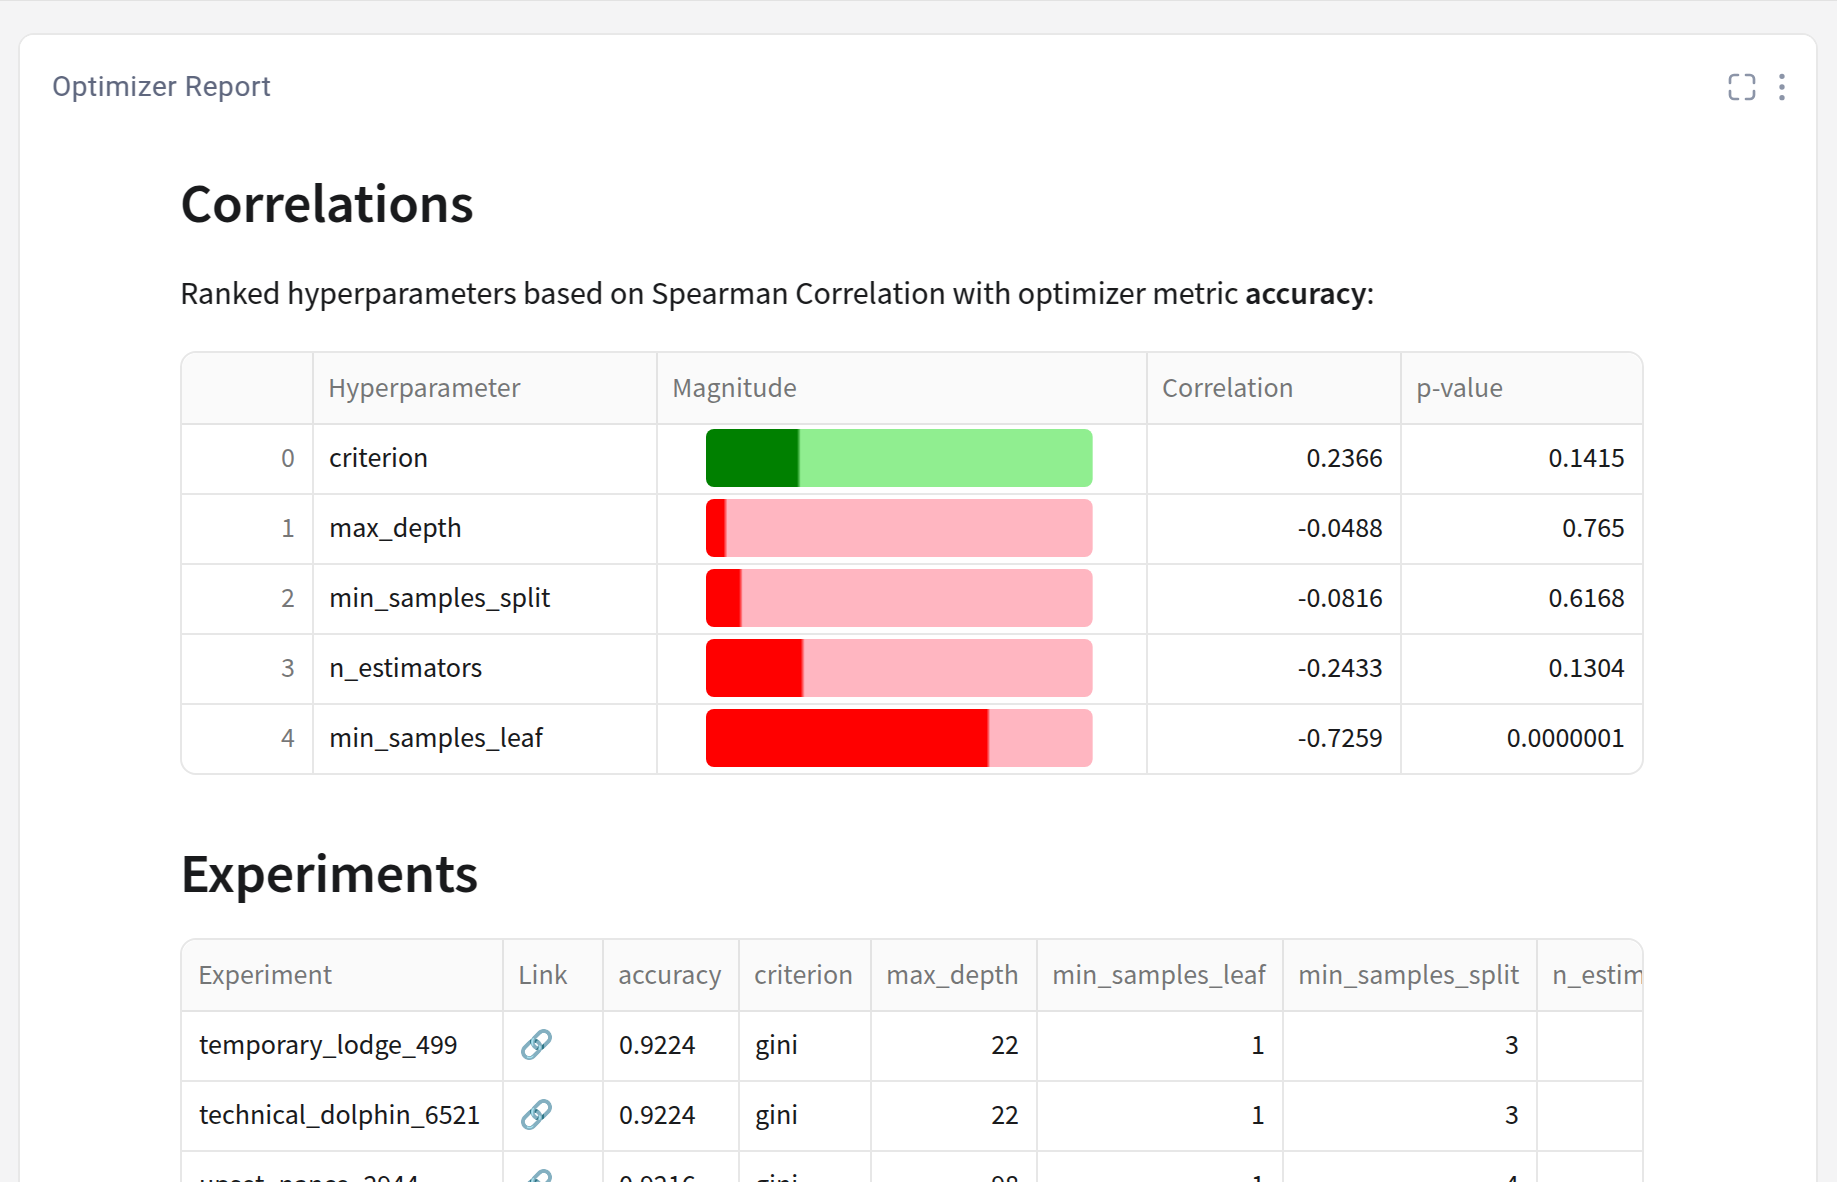
Add an Optimizer Report
The Optimizer Report is a Featured Panel that is especially designed to report Comet Optimizer results.
The report provides two table views:
- At the top, ranked hyperparameters by their Spearman Correlation with the optimization metric.
- At the bottom, experiments ranked from best to worst performance given the optimization metric with associated hyperparameter selection.
To set it up, you can simply:
- Click on the Add panel button.
- Navigate to the Features tab and choose Optimizer Report.
(Optional) Update chart Options or add Filters to the chart.
Note that you can find information on the options and other relevant information in the Description tab of the Code Editor, which you can access by clicking on <>Edit Code from the Panel Editor.
Save the chart by clicking on Done in the bottom-right corner.
Analyze tuning results in the Single Experiment Page
There is no major difference in how you navigate the Single Experiment Page to analyze a tuning experiment vs. a classic training experiment.
You will likely find yourself reviewing all logged experiment attributes, with a special focus on metrics and evaluation-related assets.